
The first half of 2022 saw supply chain disruptions, interest rate hikes amid rising inflation, and geopolitical tensions sour sentiment, creating a complex environment for equity markets. The S&P 500® was down 20%, which represented the worst start of the year since 1970. What was the impact on other S&P DJI U.S. equity indices and their competitors? In this blog, we analyze and compare the mid-year absolute and relative performance of various S&P DJI U.S. equity indices and CRSP equity indices designed to represent similar segments.
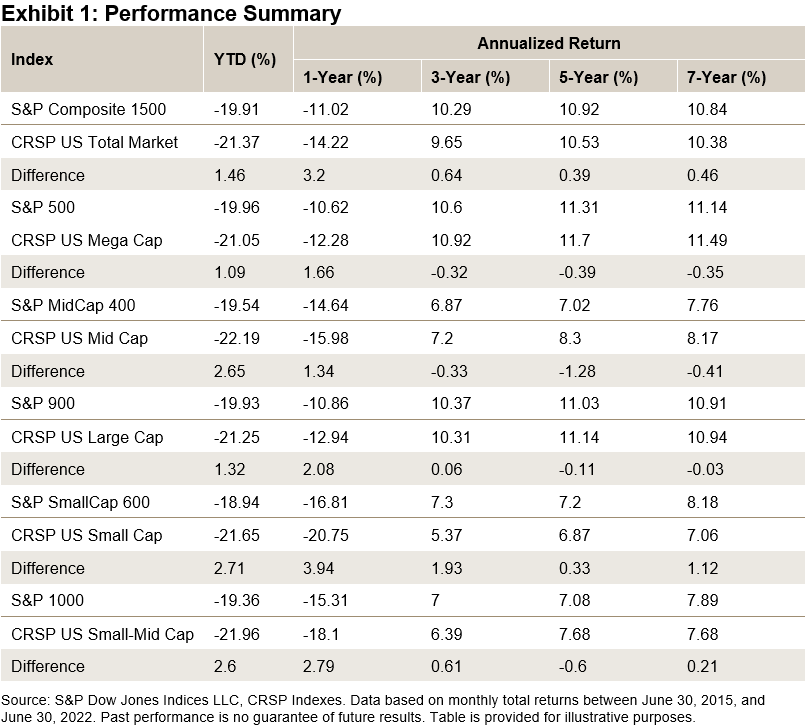
The S&P Composite 1500® is designed to measure the performance of U.S. equities across the size spectrum by combining the S&P 500, S&P MidCap 400®, and the S&P SmallCap 600® in float-market cap proportions. But the S&P 1500® is not alone in seeking to measure the U.S. equity market; the CRSP US Total Market Index has a similar objective.
Exhibit 1 shows that the S&P 1500 outperformed the CRSP Total Stock Market Index over various horizons. The S&P 1500’s outperformance typically came from across the cap spectrum: the S&P 500, S&P 400®, and S&P 600® outperformed their respective CRSP counterparts in several periods, mainly on a YTD and 1-year basis.
(Click on image to enlarge)
Differences in index construction can help us to understand these performance differentials. Exhibit 2 summarizes the methodologies underlying the S&P DJI U.S. equity indices and their CRSP counterparts. One of the biggest differences between the methodologies is that, unlike the CRSP indices, the S&P 1500 and its component indices use an earning screen: new index additions must have a history of positive earnings.
(Click on image to enlarge)

Exhibit 3 shows the impact of the earnings screen on the S&P Composite 1500s and S&P SmallCap 600’s factor exposures: each S&P DJI U.S. equity index has statistically significant positive quality exposure. Similar results can be obtained for other market cap segments. Given the role of the quality factor in driving relative returns against other indices, particularly in small caps,1 differences in performance and factor exposures once again highlight the importance of index construction.
(Click on image to enlarge)

The methodology differences can also affect the indices’ sector exposures and the selection of companies within sectors. Exhibit 4 shows the 2022 average weight of each index to the IT sector as well as the allocation and selection effect specifically for the IT sector. The S&P U.S. Indices’ lower exposures to IT meant they were more insulated against the sector’s drawdowns in the first half of 2022. Interestingly, the S&P U.S. Indices’ choice of IT stocks proved more resilient than their CRSP counterparts and the selection effect was more important across the cap spectrum.
(Click on image to enlarge)
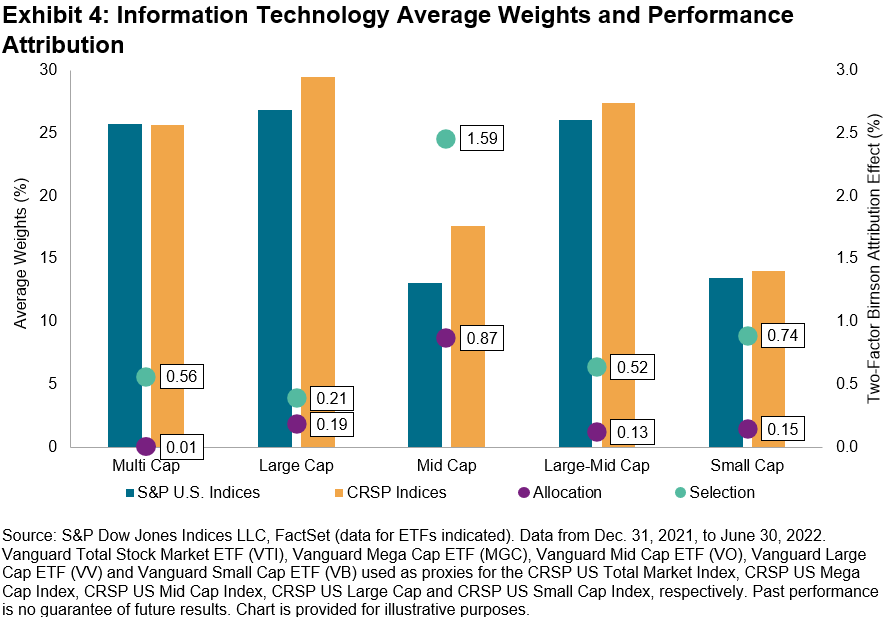
On average, the S&P DJI U.S. equity indices outperformed their CRSP counterparts by 2.0% in the first half of 2022 and 2.5% on a trailing one-year basis. These results were driven by differences in index construction, which led to the S&P U.S. Indices having meaningful exposure to the quality factor, lower exposure to the IT sector, and the selection of IT companies with stronger performance.
1 See https://www.indexologyblog.com/2022/01/26/sp-smallcap-600-a-pandemic-case-study/
More By This Author:
Defensive Dynamics
The S&P Systematic Global Macro Index Outperformed YTD
Infrastructure To Strengthen A Portfolio In Volatile Times


Comments
Log in or sign up to join the conversation.