
S&P 500, SPY, ES Gap Fill Strategy And Statistics

Image Source: Pixabay
If the SPDR S&P 500 ETF (SPY) gaps down, what are the odds it will fill the gap? Knowing that statistic can provide a strategy idea, if the percentage of a fill (or non-fill) is strong. Let’s look at when the data is strong, how to build a strategy around that idea, and a trade example.
When the S&P 500 gaps up or down, over the last 6 months, it has filled the gap right around 60% of the time (based on stock market hours). This applies to SPY, ES or other similar instruments based on the S&P 500. A slight edge, but not too impressive.
With Edgeful—software that provides real-time statistics (continually updated) on all sorts of patterns and variations—we can dig into various scenarios to find higher percentage trades. Their data is provided below.
Video Length: 00:17:15
For example, we can filter by day of week. There are definitely scenarios that are more favorable than others.
| Gap Up Filled | Gap Down Filled | |
| Monday | 54% | 70% |
| Tuesday | 67% | 55% |
| Wednesday | 62% | 80% |
| Thursday | 57% | 60% |
| Friday | 64% | 20% |
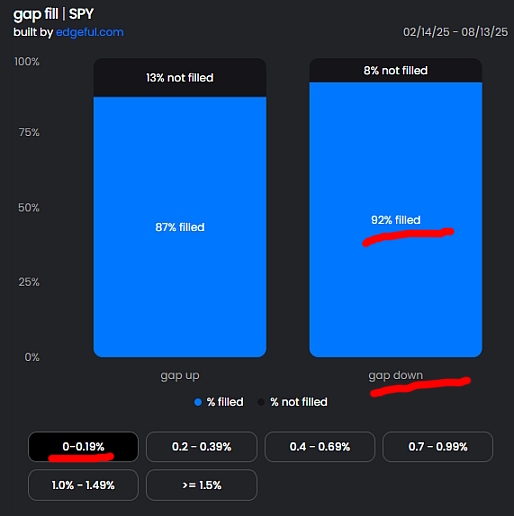
We can also filter by size since small gaps require less movement to fill them. They occur more frequently and fill more often than large gaps.
| Gap Size | Gap Up Fill | Gap Down Fill |
| 0-0.19% | 87% | 92% |
| 0.2% to 0.39% | 53% | 69% |
| Increments >0.4% | Success rates vary, but below 50% | Success rates vary, but below 50% |
During this 6-month period, the S&P 500 was in an overall uptrend (always look at stats relevant to the market environment being traded in). So if the uptrend remains in play, the statistics are relevant. With access to Edgeful, the statistics are updated daily. The statistics could look quite different during an extended sideways period or a downtrend.
Recall that during this time, the S&P 500 was in an uptrend. Therefore, small gaps down tend to fill quite often. Maybe Friday is the only day we wouldn’t be quite as eager to jump on buying a gap down.
If the price gaps down 0.15%, there is a pretty high probability (92%) that the price will fill the gap at some point during the day. Monday to Thursday all have at least decent fill percent chances, so this would be a green light to watch for a gap fill if SPY gaps down.
Even if the price gaps down 0.35%, which requires a bigger move for the gap fill (and thus more profit potential), the odds of a fill are still quite high at 69%. Maybe shy away from the trade on Friday, but the other days of the week give a green light to trade the pattern. That said, you can decide for yourself what percentages you are willing to trade, and which you aren’t.
SPY Gap Fill Entries and Exits
Exiting at the prior close is a simple exit plan for this strategy, since the statistics measure how often the price gaps away from the prior close and then touches it during the current session. This could be fine-tuned as well, running statistics in Edgeful on different fill percentages. This data is based on a 100% gap fill, but you could see what the data is on 75% gap fills (higher fill rate, but lower reward), or 120% gaps fills (lower fill rate but higher reward).
There are many ways to enter such a trade.
I have patterns I like to trade, such as TCs, RBs, Snap Backs, Double Pumps, and so on. I can combine these support and resistance levels I am seeing through the initial minutes of the day to help establish entry points.
Edgeful provides some other potential entry points.
Opening Candle Continuation is one such example. The breakout direction of the first 15-minute candle often provides clues as to the rest of the day. 64.41% of the time, when the price breaks the opening 15-minute range to the upside, the day closes green.
So, if the price gapped down, and we are waiting for a gap fill to the upside, we could wait for a break to the upside of the opening 15-minute range (the opening Candle Continuation is especially strong on Tuesday, Thursday, and Friday, all above 70%).
Stop loss: A simple method is to put a stop loss at the 15-minute opening range low, following an upside opening range breakout (entry). Edgeful’s data on Opening Range Breakout Retracements provides some fine-tuning.
Once the breaks above the 15-minute opening range, the day tends to stay green, but that doesn’t mean it stays above the opening range and never moves back into it. The price retraces up to 50% of the opening range about half the time, but it only retraces to the 75% mark of the opening range 15% of the time. So a stop loss near the 75% retracement allows us to reduce our risk a bit, with the odds of the price retracing all the way to the stop loss relatively low.
Gap Fill Trade Example on SPY
I am writing this on August 14, 2025, because a trade played out in SPY using this method.
The price gapped down 0.32%. That is right in our wheelhouse of high probability gap fills during an overall uptrend.
This means we are on the lookout for a gap fill to the upside (reaches August 13 close).
If using the Opening Candle Continuation entry method, wait for a breakout of the opening 15-minute range.
Place a stop loss at 75% of the opening range. If the range is $1, and you are buying at the top of the opening range, then the stop loss should be $0.75 (0.75%) below entry, or $0.25 (0.25%) above the bottom of the range.
The target is the prior day’s close.
(Click on image to enlarge)
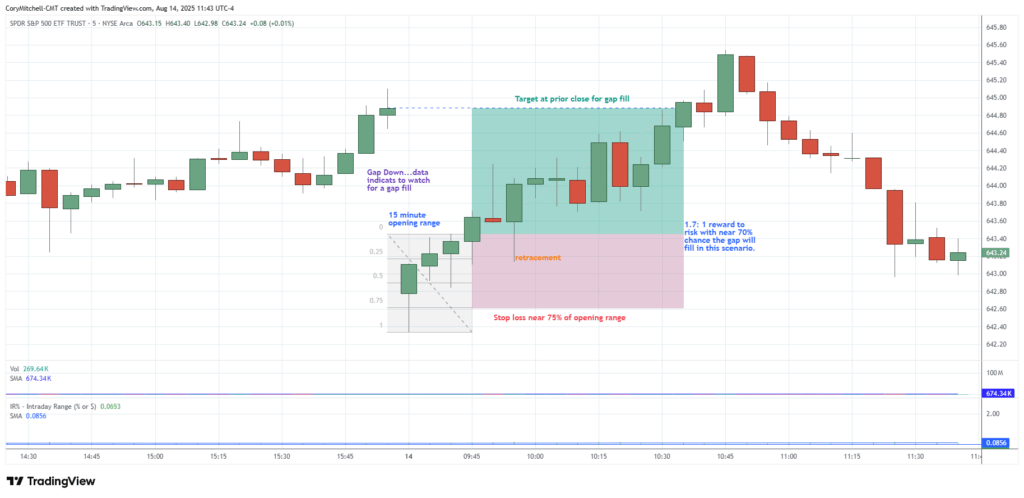
On this day, the trade provided a 1.7:1 reward to risk, with a roughly 60-70% chance of winning on the trade. A TC entry on the 1-minute chart would have brought the R:R up to 2.27:1.

Edgeful data also lets us know that 80%+ of gaps fill by noon EST. This makes it a nice day trading strategy because it doesn’t require sitting in front of the computer all day.
Final Word on SPY Gap Fill Strategy
This is more of a “swing” day trade, as opposed to a scalping style strategy. While re-entries may be possible in certain cases, or adding to a position while the trade remains open, it is more of a one-and-done style of trade.
This means it can be used in the background while trading more active strategies, or it could be used by traders who favor less hectic/active trading, and are more inclined to be in trades for up to a few hours.
Edgeful provides TradingView indicators for most of these statistics (subscription required), which place the levels to watch right on the chart. Their new automation tools can highlight the entry, stop loss, and target levels, and even place the trade if linked to an account. I am more old-school and like placing trades myself, so I haven’t tried any of the automation stuff, but I do find the access to data very helpful for building new strategies or enhancing old ones.
Data evolves over time. During a certain period, something may work amazingly, but then stop working as well. This is why it is helpful to have access to the data (or track yourself), so we can see what is working over various time frames and market conditions.
More By This Author:
EURUSD Day Trading ChartsHow To Commit To A Trading Decision
Relative Strength Index (RSI) Deep Dive – How This Technical Indicator Works And Methods
Disclaimer: Nothing in this article is personal investment advice, or advice to buy or sell anything. Trading is risky and can result in substantial losses, even more than deposited if using ...
more

