S&P 500 Snapshot: Steady End To The Week
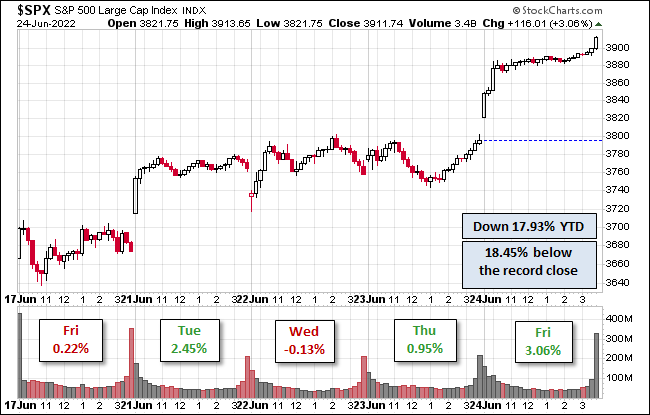
The S&P 500 opened Friday higher than its Thursday close and stayed steady throughout the day. The index is up 3% from Thursday, is 18.5% below its record close, and is down 17.9% YTD.
The U.S. Treasury puts the closing yield on the 10-year note as of June 24 at 3.13% which is above its record low (0.52% on 8/4/2020). The 2-year note is at 3.04%. See our latest Treasury Snapshot here.

Here's a snapshot of the index going back to 2012.

A Perspective on Drawdowns
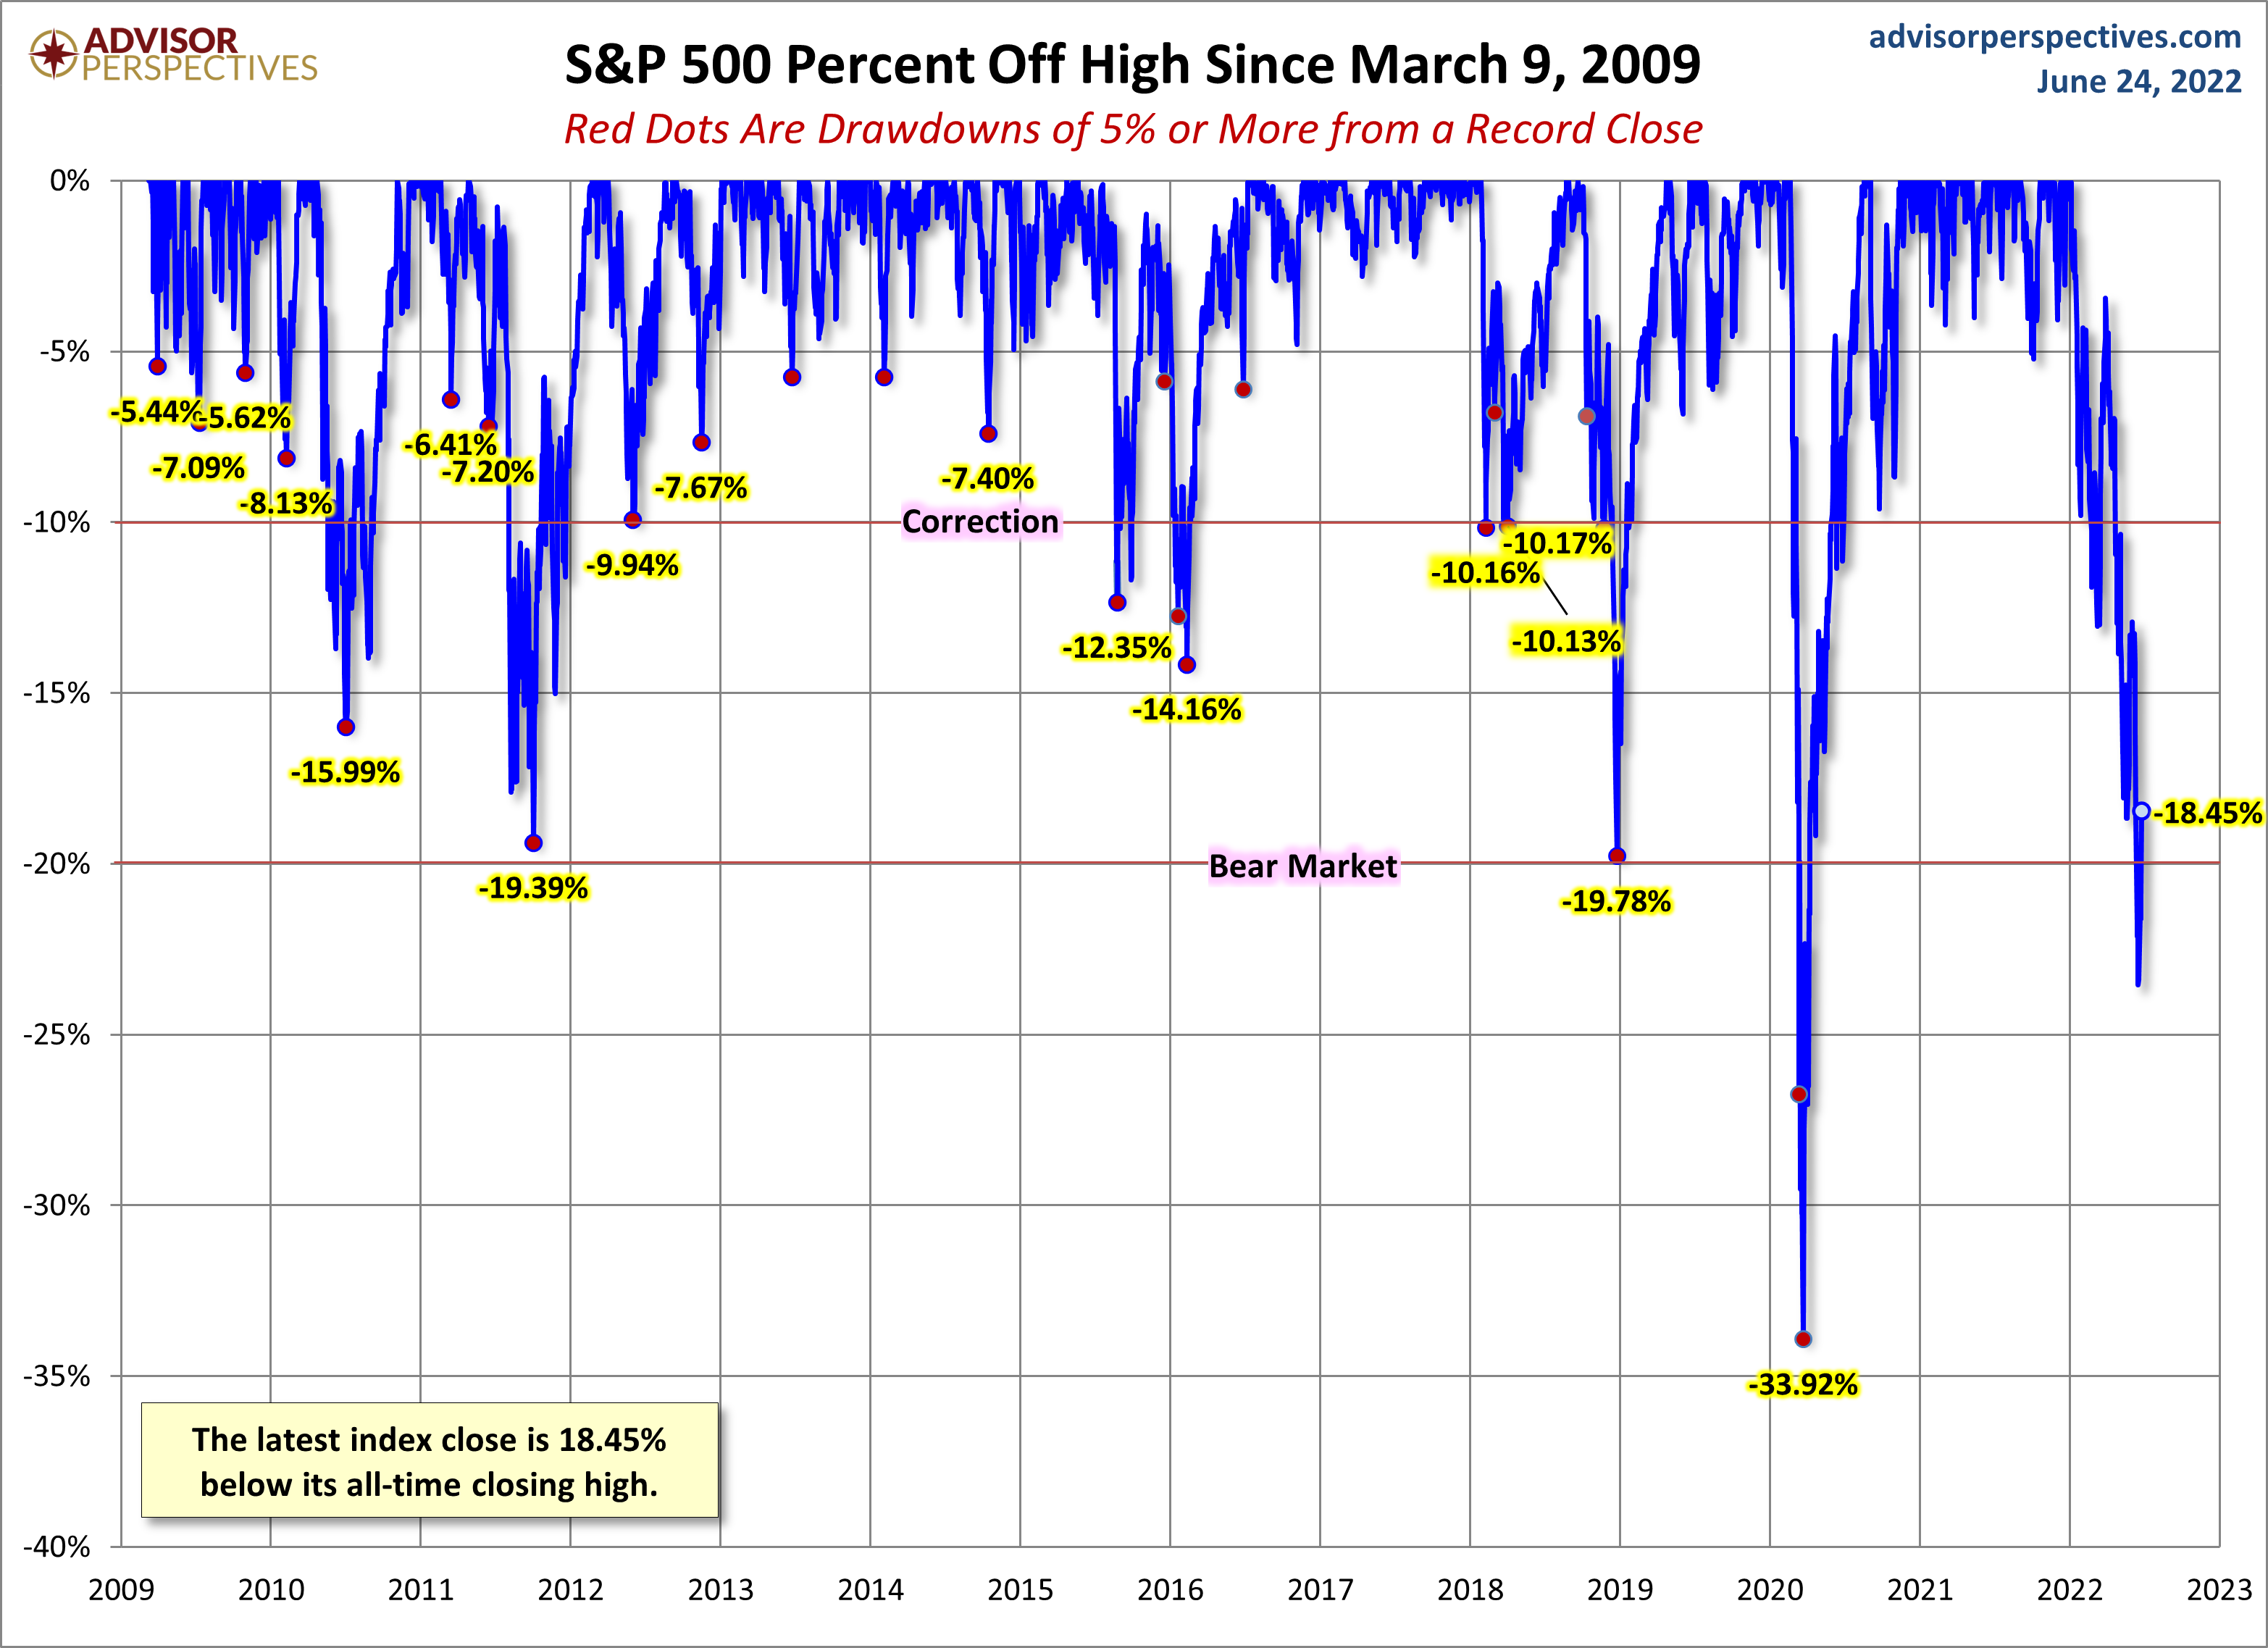
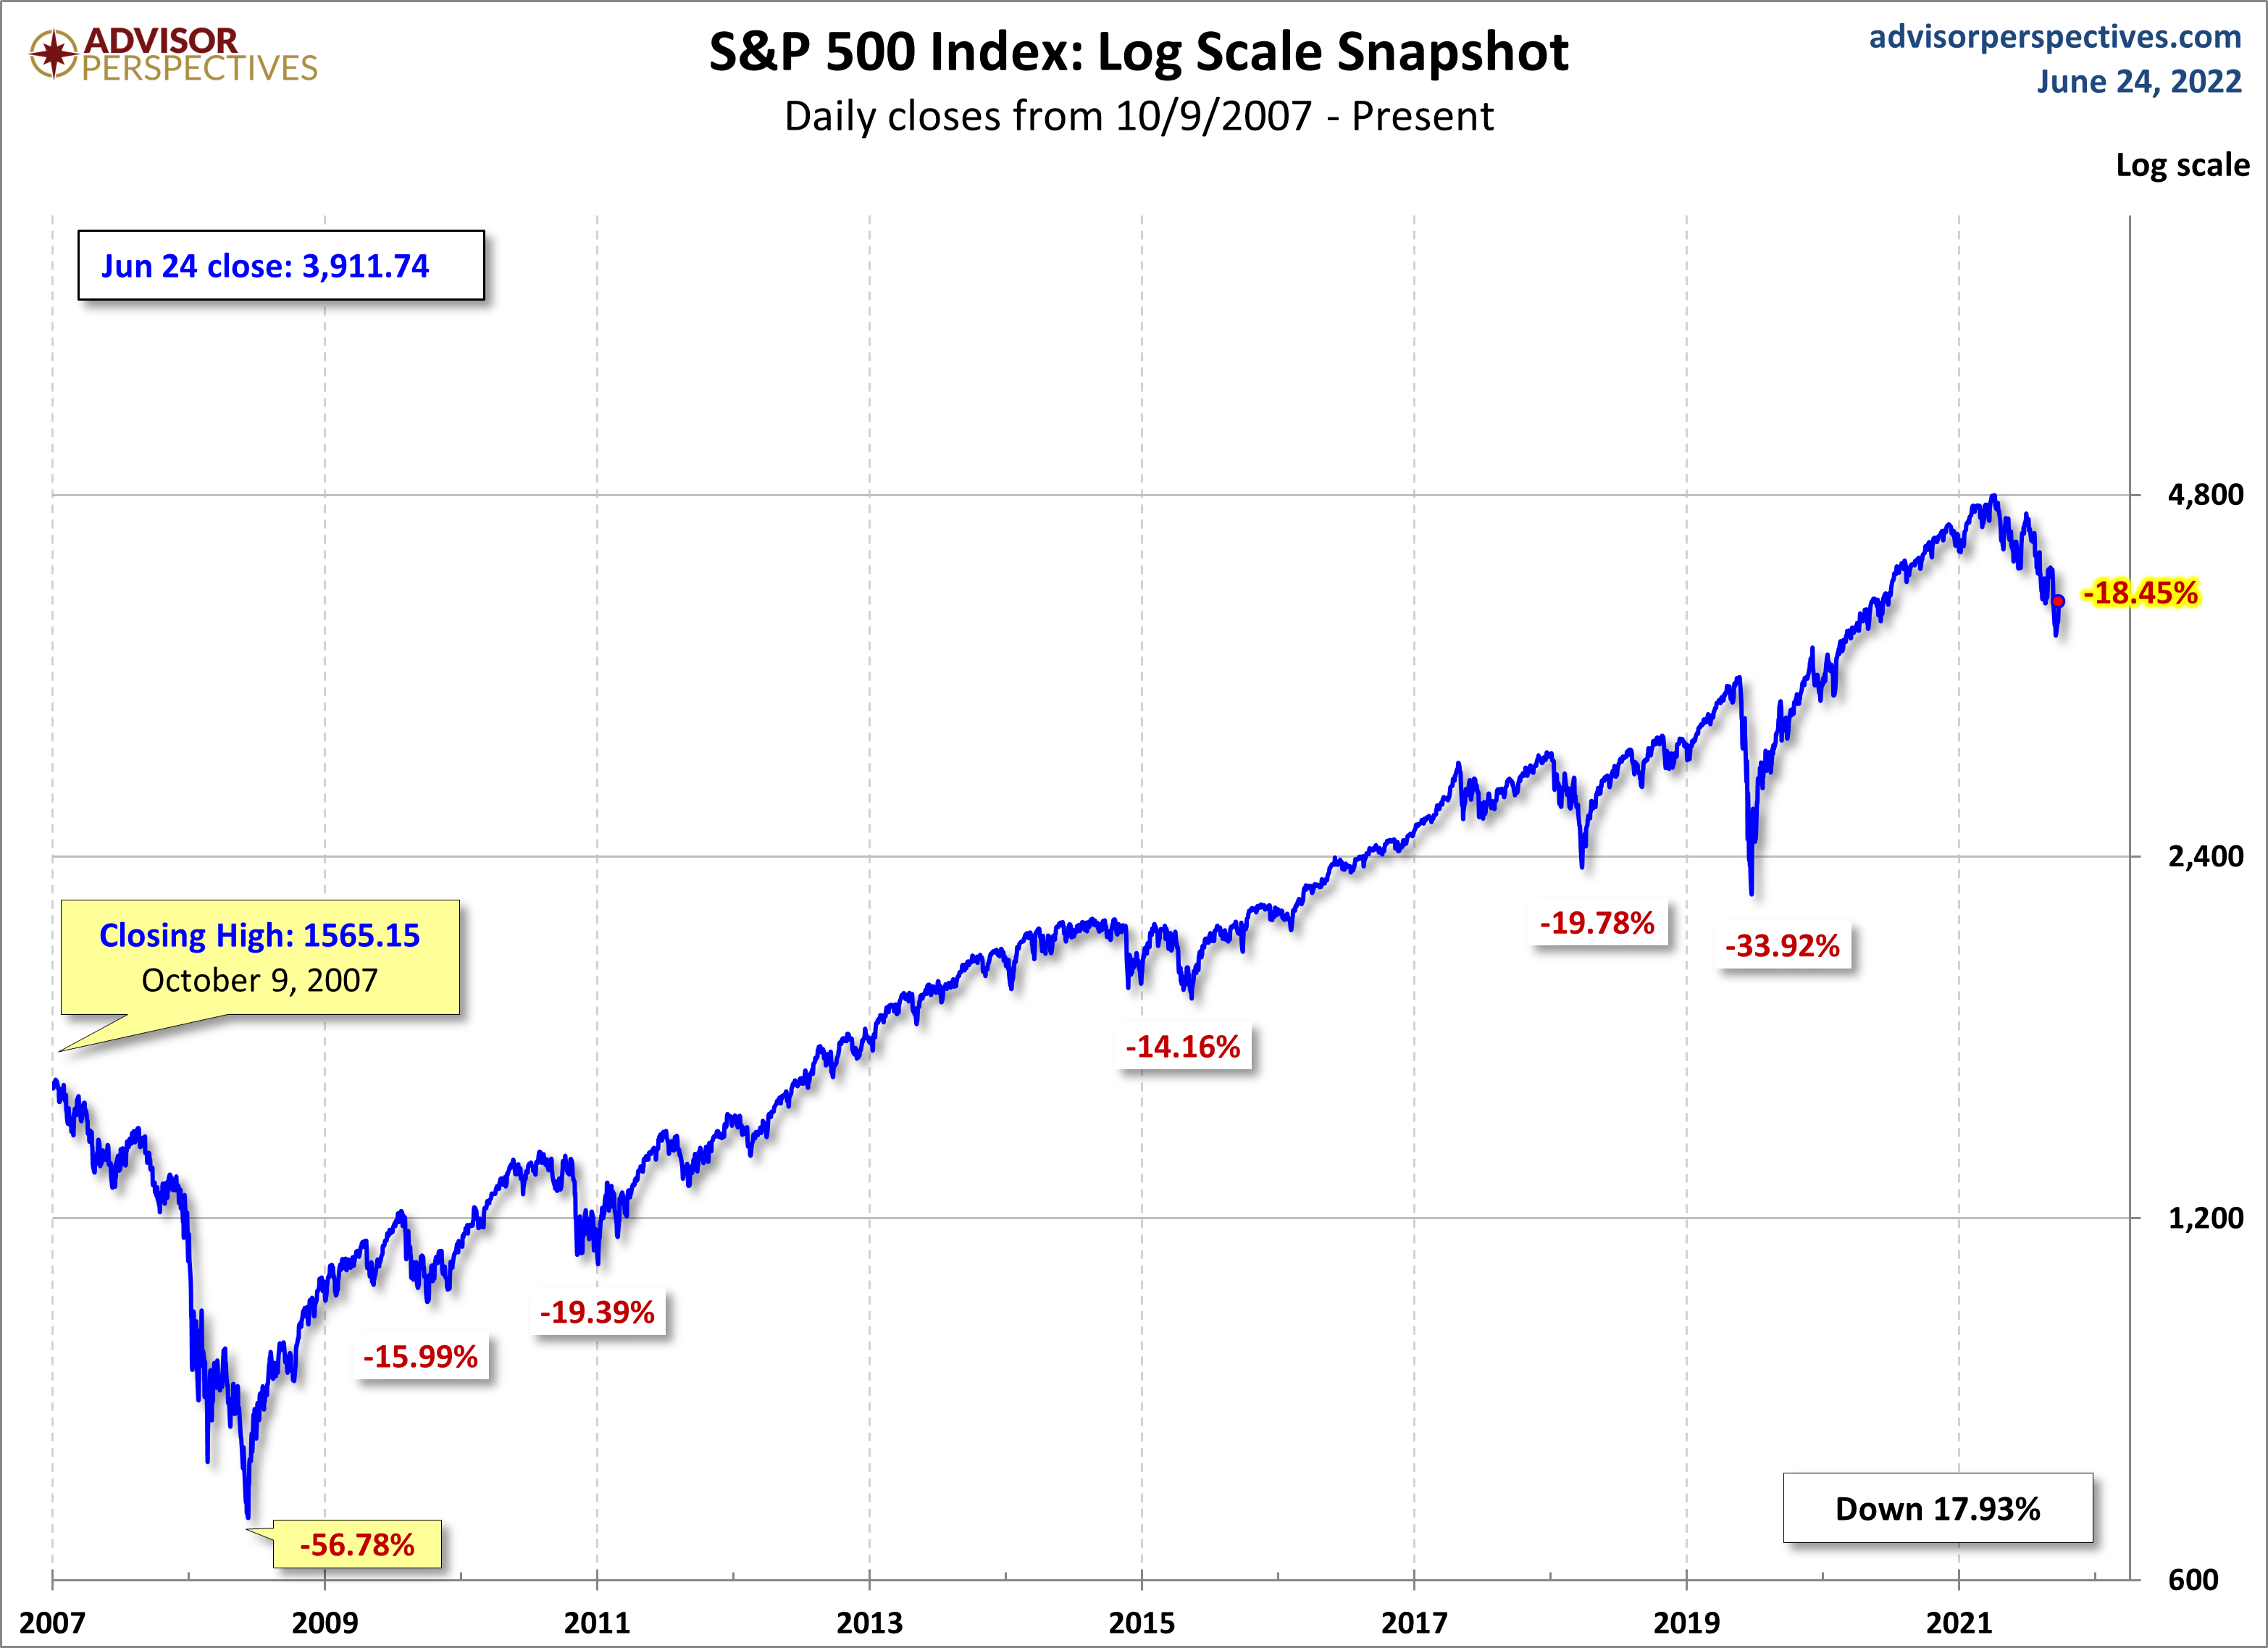
Here's a snapshot of record highs and selloffs since the 2009 trough. Note the recent selloffs in 2022.
(Click on image to enlarge)
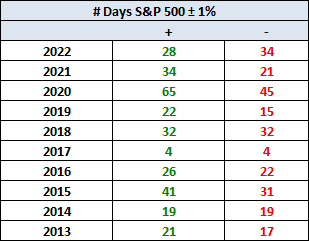
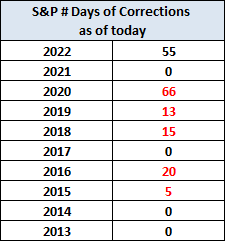
Here's a table with the number of days of a 1% or more change in either direction and the number of days of corrections (down 10% or more from the record high) going back to 2013.
Here is a more conventional log-scale chart with drawdowns highlighted.
(Click on image to enlarge)
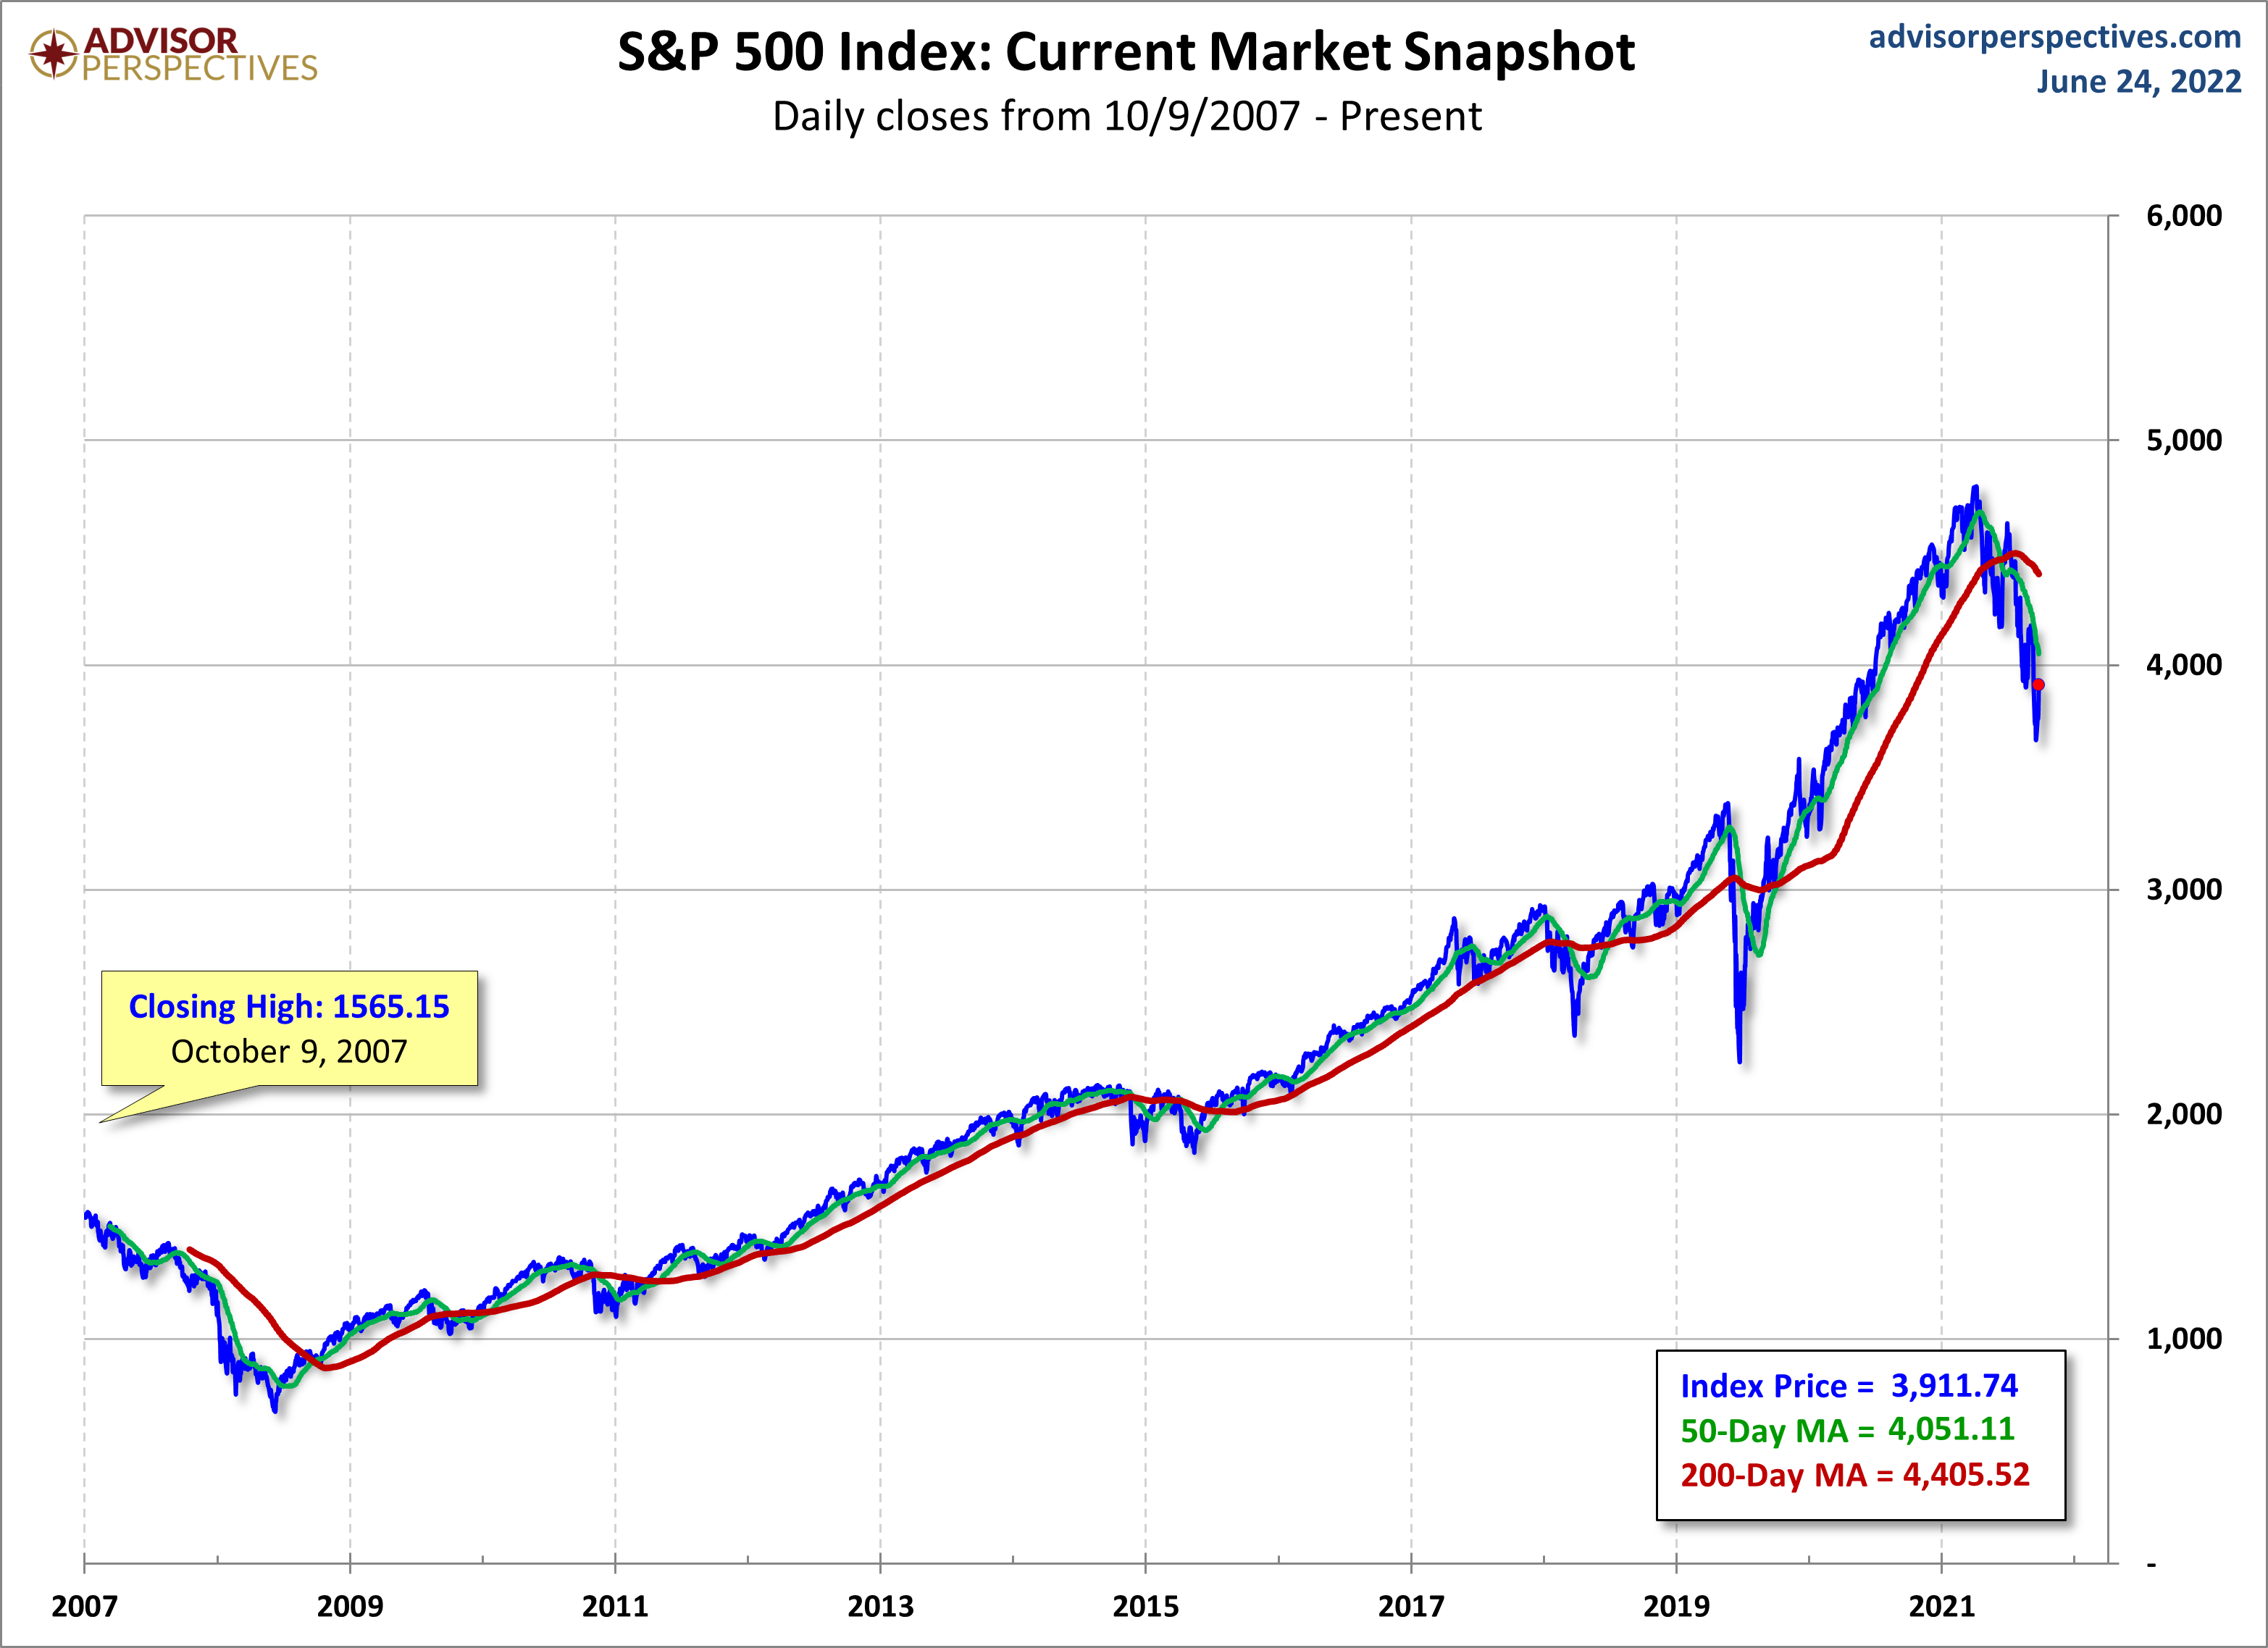
Here is a linear scale version of the same chart with the 50- and 200-day moving averages.
(Click on image to enlarge)
A Perspective on Volatility
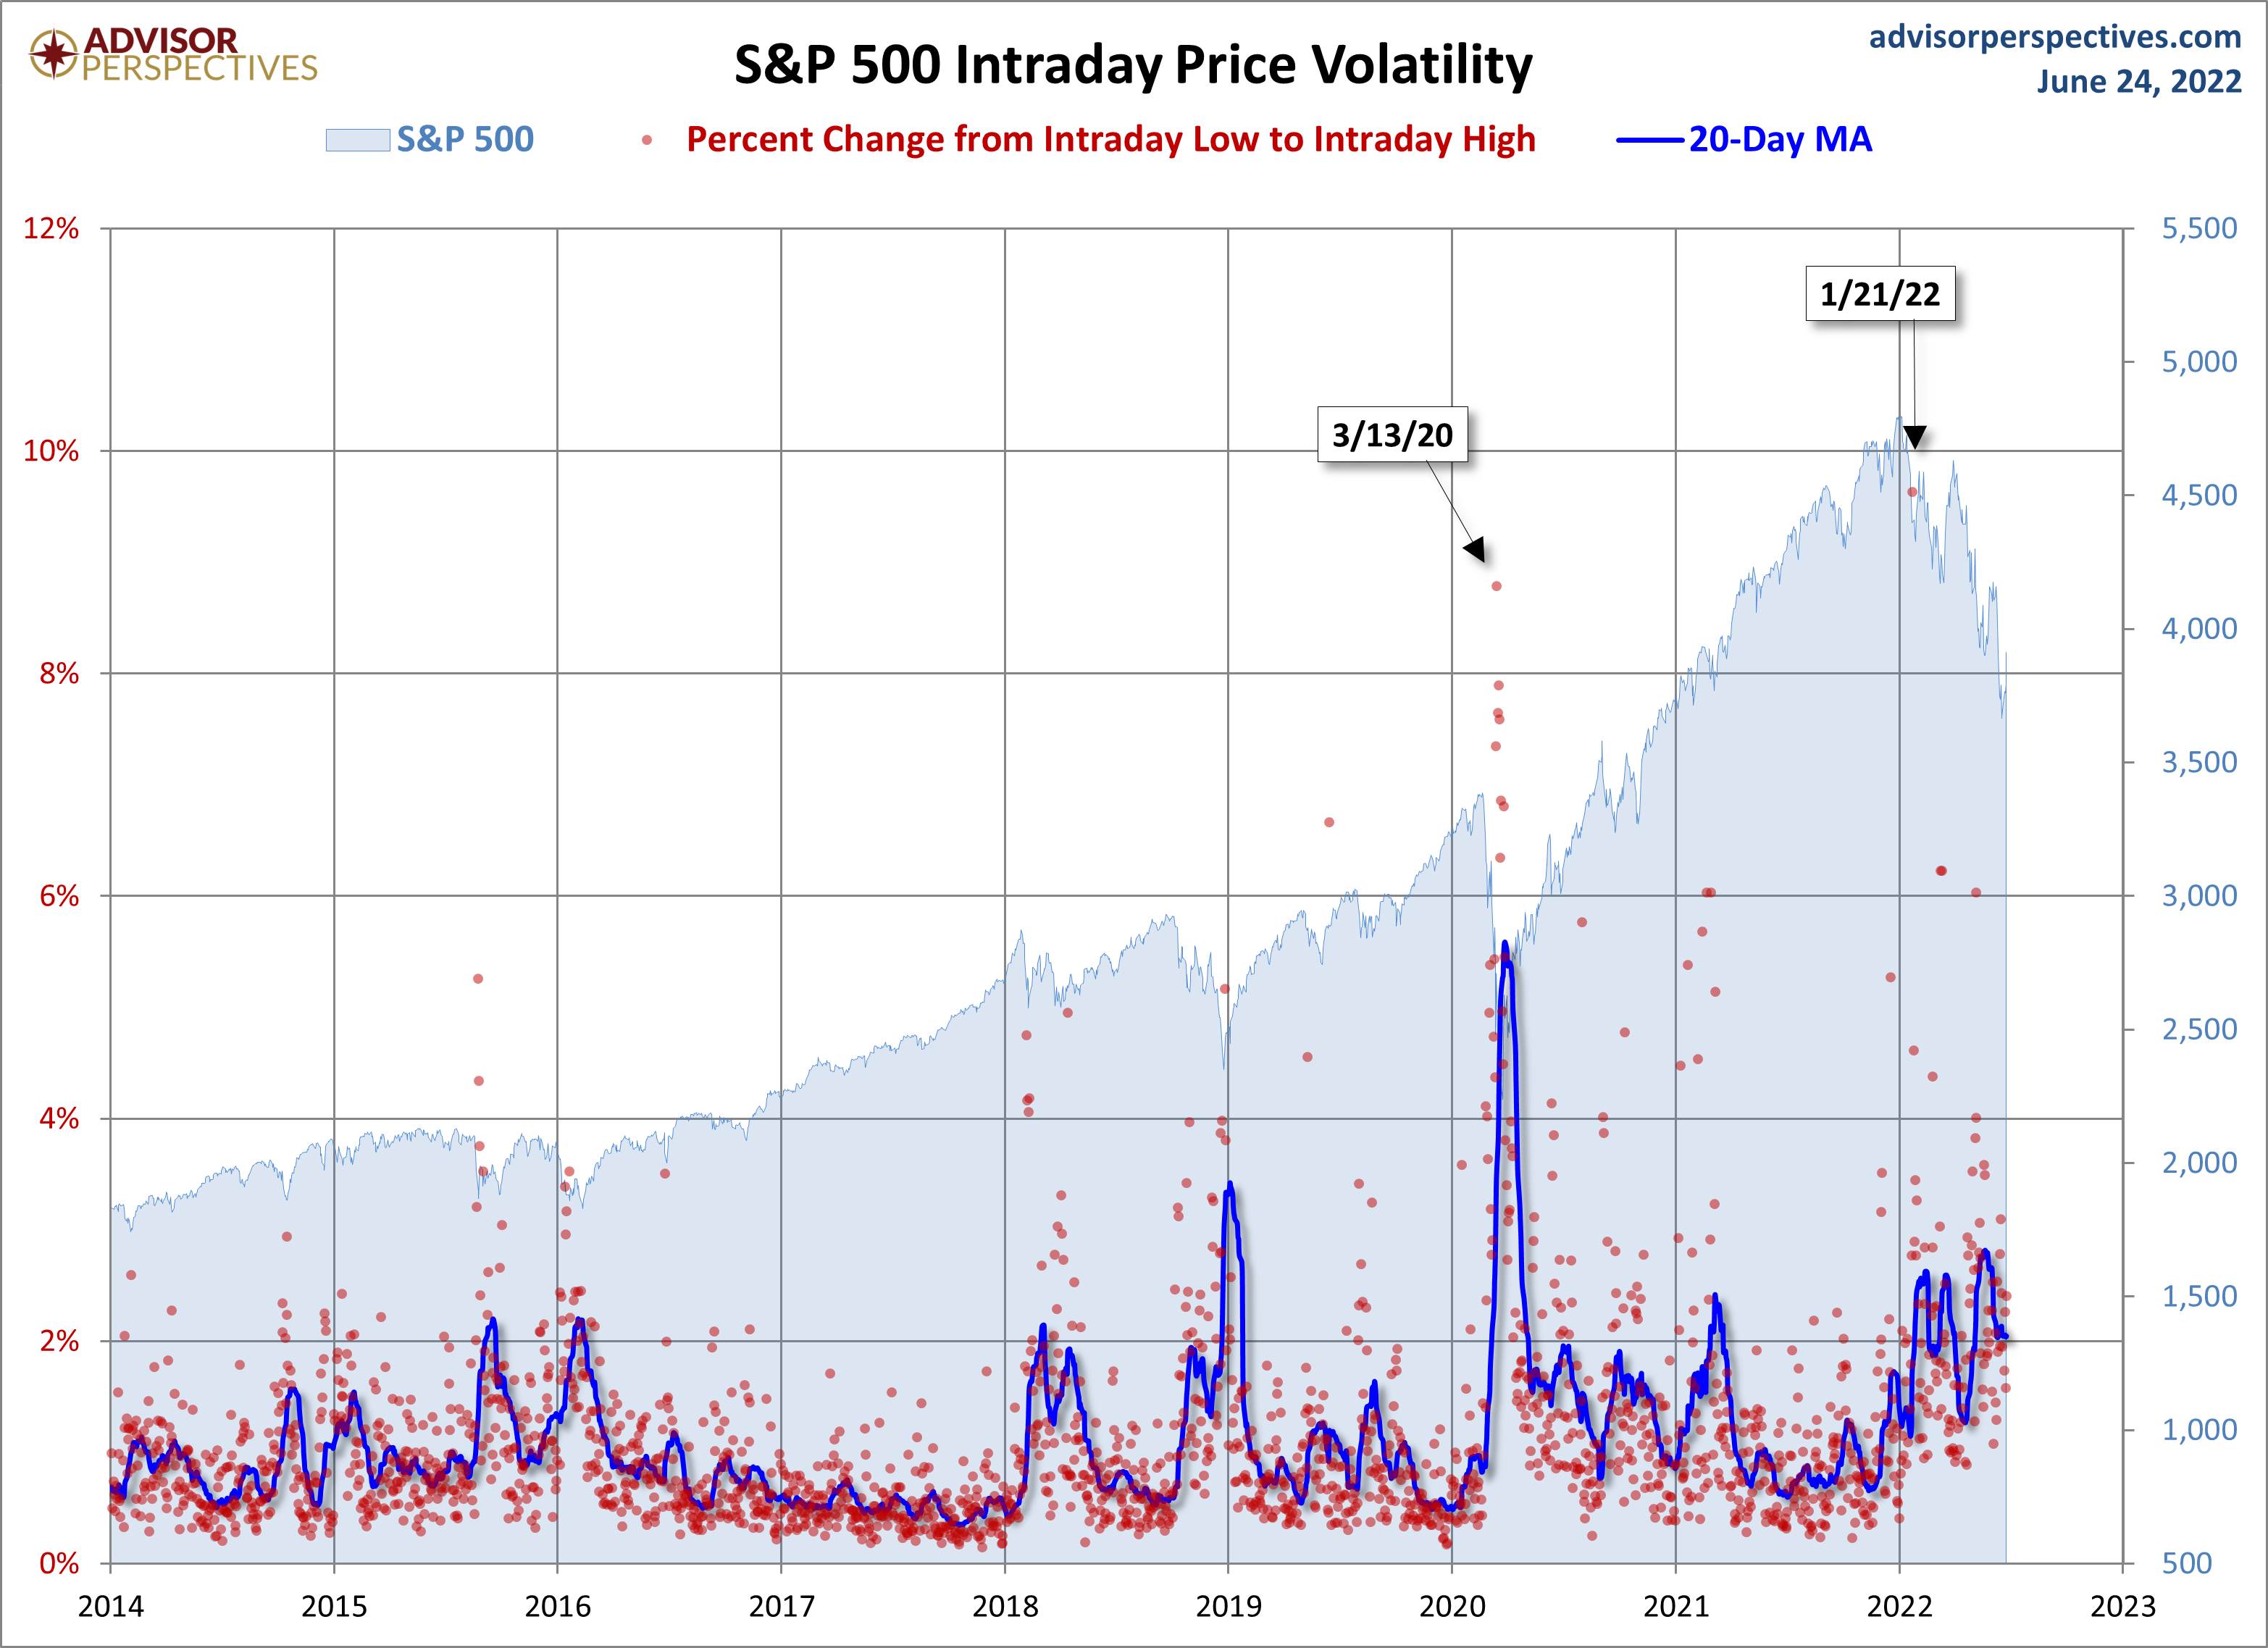
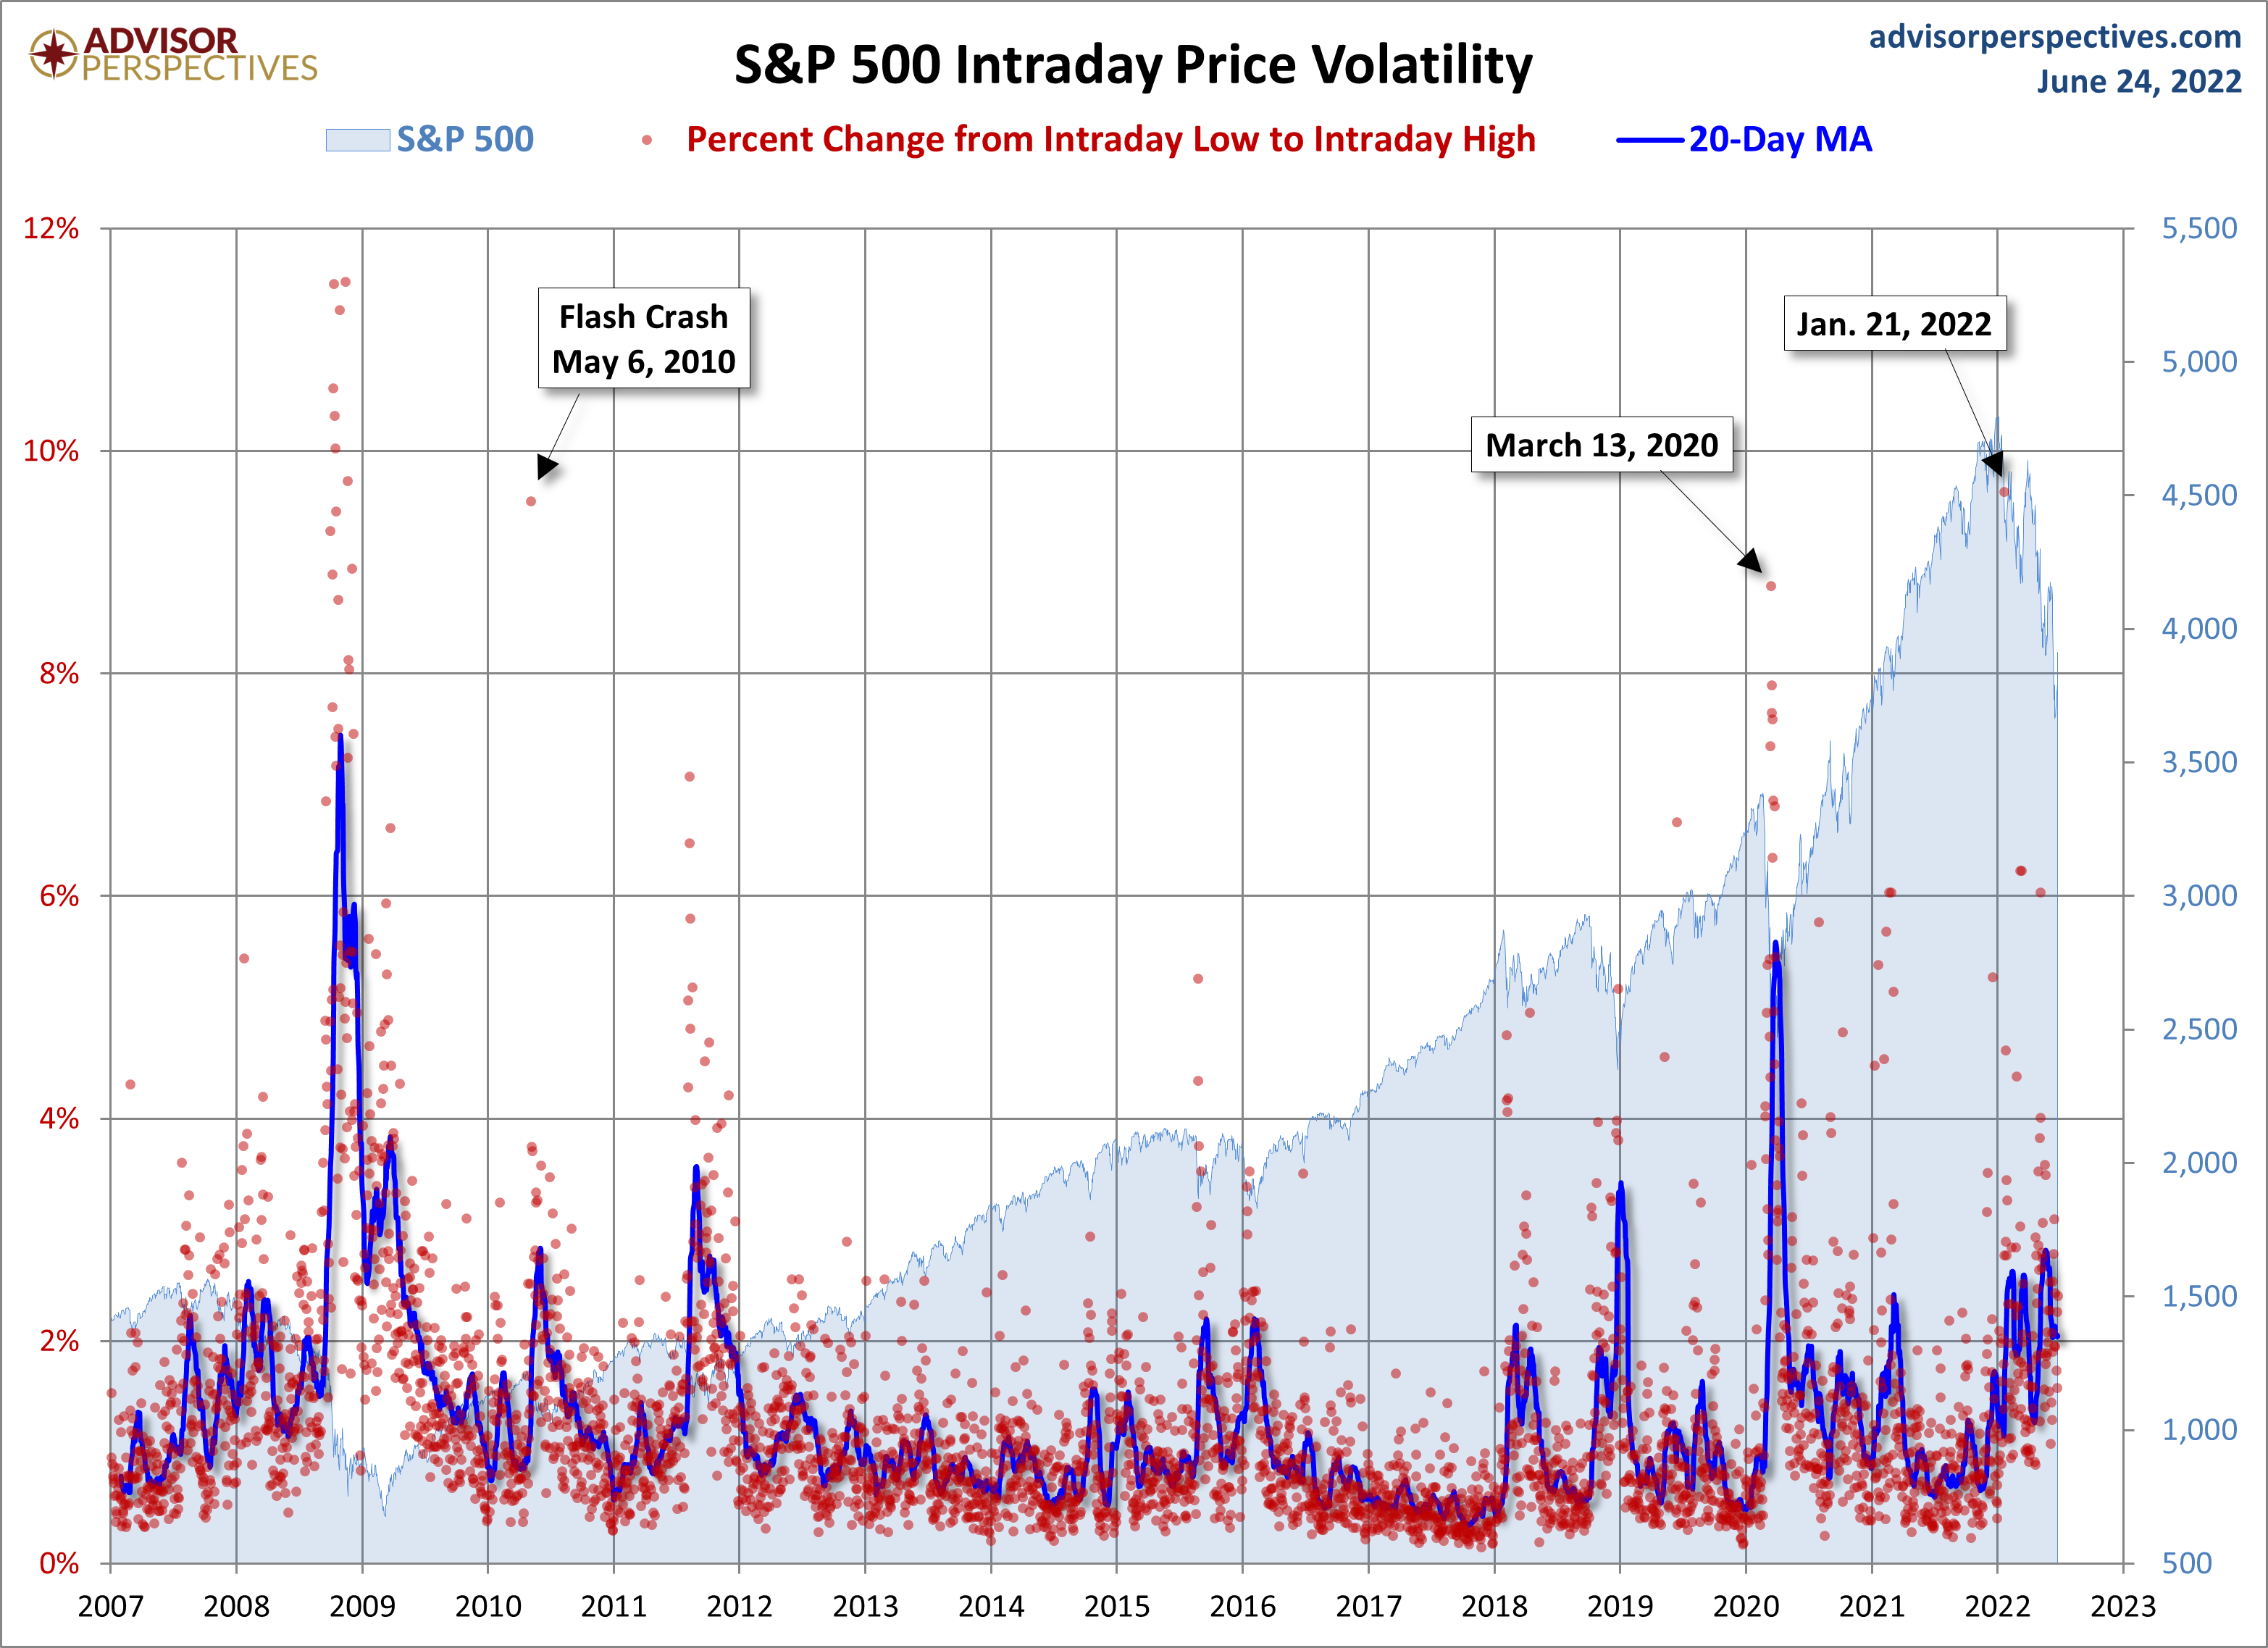
For a sense of the correlation between the closing price and intraday volatility, the chart below overlays the S&P 500 since 2007 with the intraday price range. We've also included a 20-day moving average to help identify trends in volatility.
(Click on image to enlarge)
Here's another look, but a slightly more recent look at volatility since 2014.
(Click on image to enlarge)