
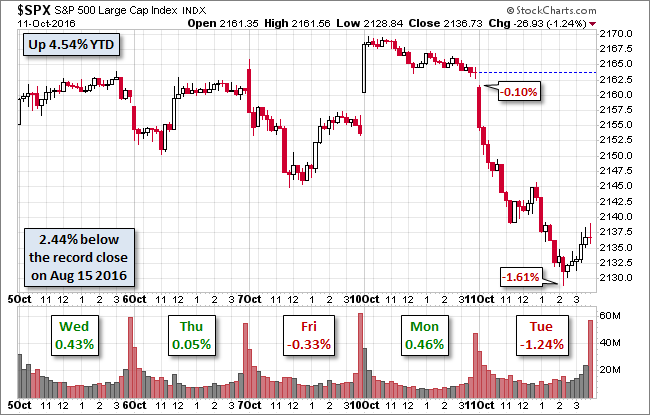
S&P 500 Snapshot: Sharpest Loss In 20 Sessions
US equities had bad session today, with the popular financial press pointing fingers at the Dollar and Oil. The Dollar Index closed the session at its highest level since March 2nd, and West Texas Intermediate Crude closed ended with a 1.09% decline. The S&P 500 plunged at the open and sold off in a couple of waves to its -1.61% intraday low. Some afternoon buying trimmed the closing loss to 1.24%, the biggest decline in 20 sessions.
The yield on the 10-year note closed at 1.77%, up four BPs from Friday's close (Monday being a bond holiday). This is the highest closing yield since June 2nd.
Here is a snapshot of past five sessions in the S&P 500.
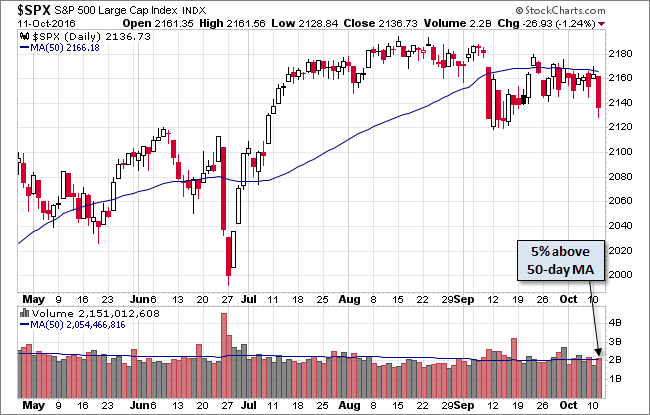
Here's a daily chart of the index. Volume on today's selloff was unremarkable.
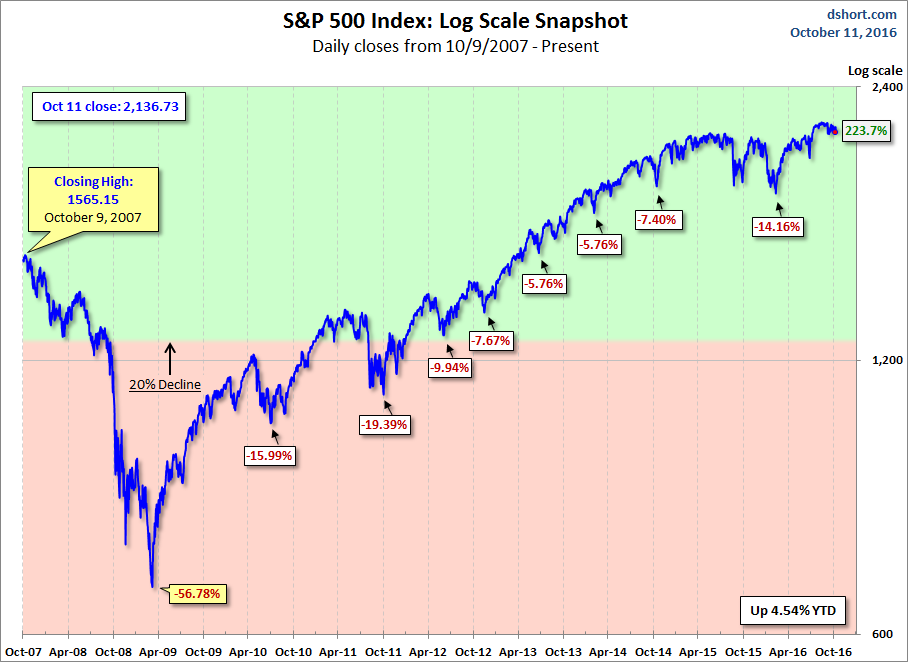
A Perspective on Drawdowns
Here is a more conventional log-scale chart with drawdowns highlighted.
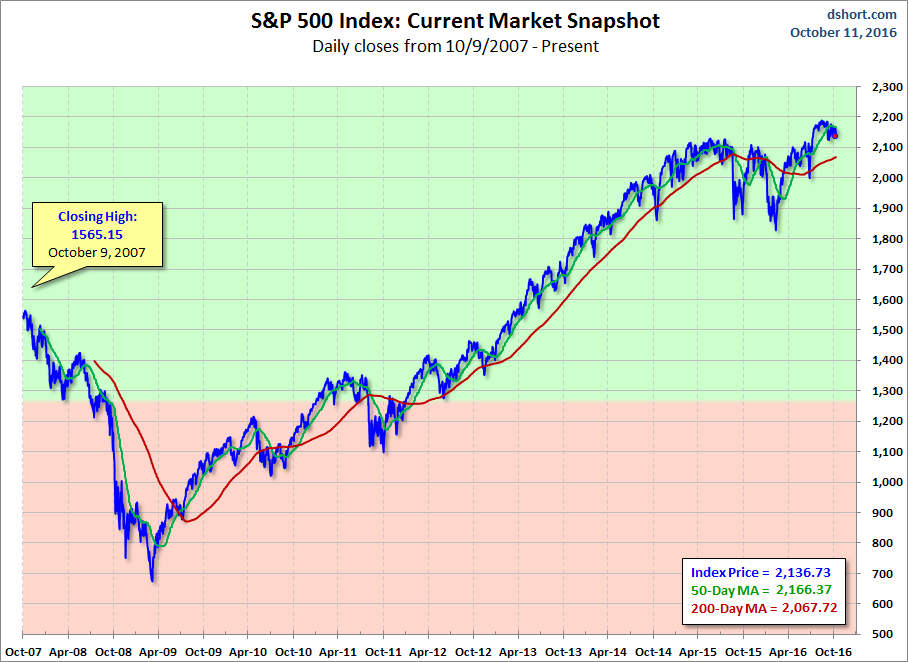
Here is a linear scale version of the same chart with the 50- and 200-day moving averages.
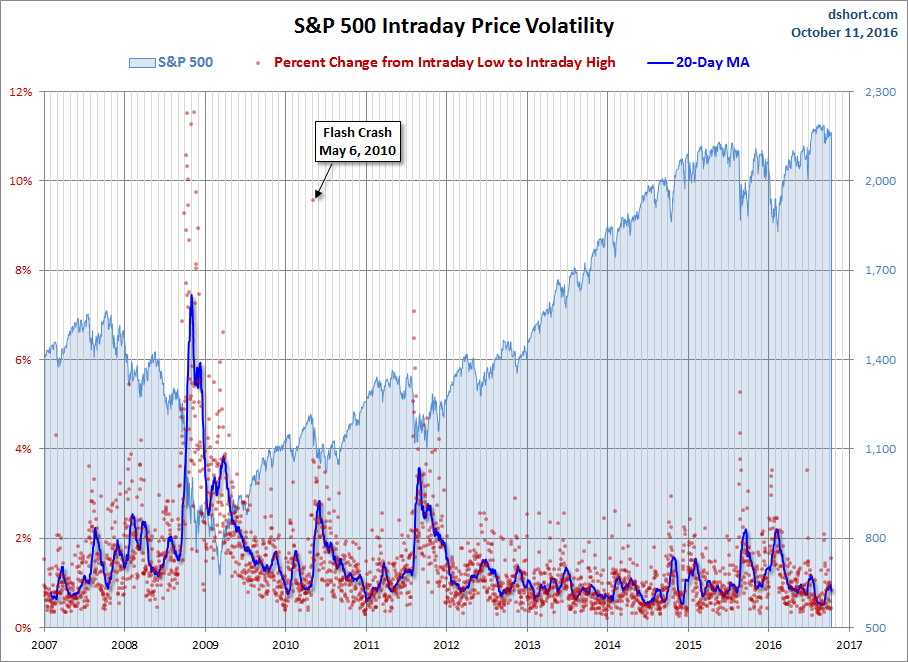
A Perspective on Volatility
For a sense of the correlation between the closing price and intraday volatility, the chart below overlays the S&P 500 since 2007 with the intraday price range. We've also included a 20-day moving average to help identify trends in volatility.
Disclosure: None.


thanks for sharings