
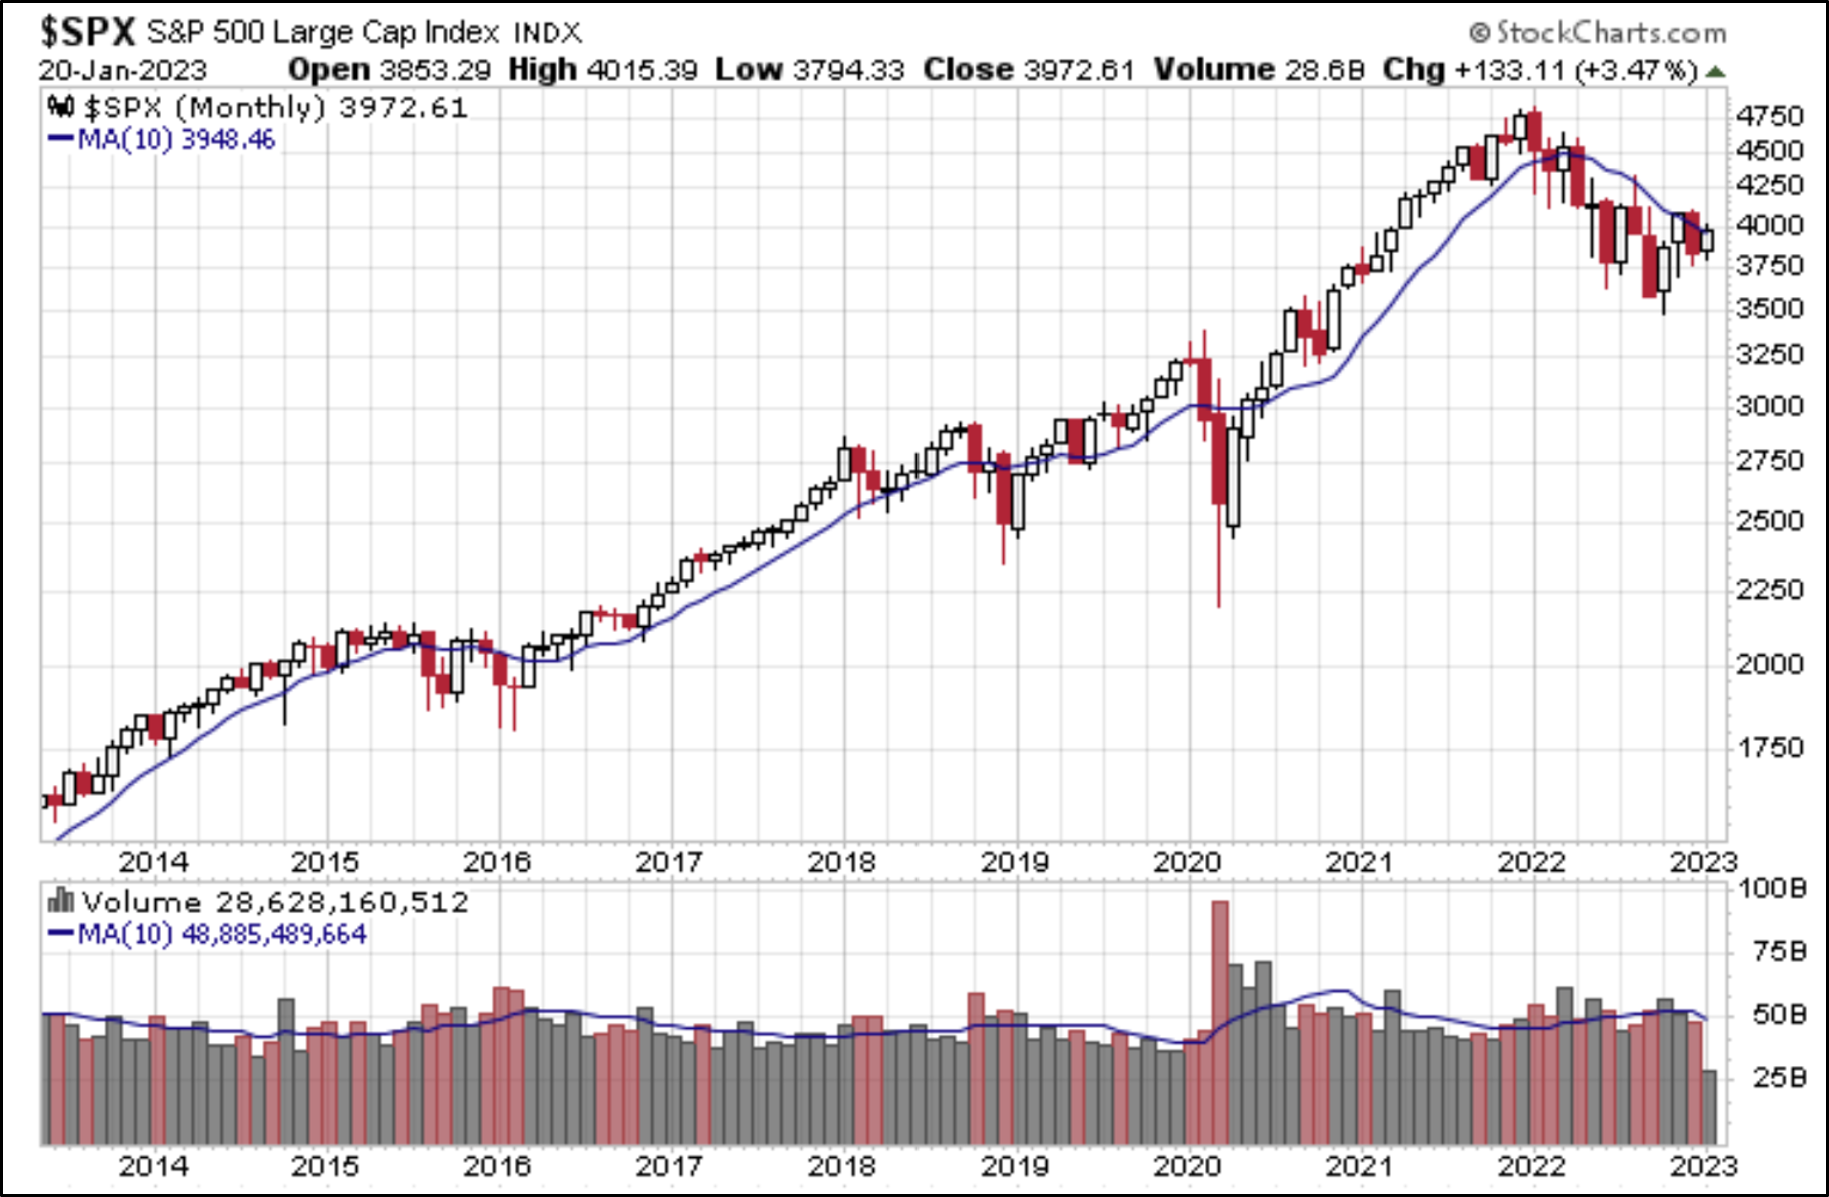
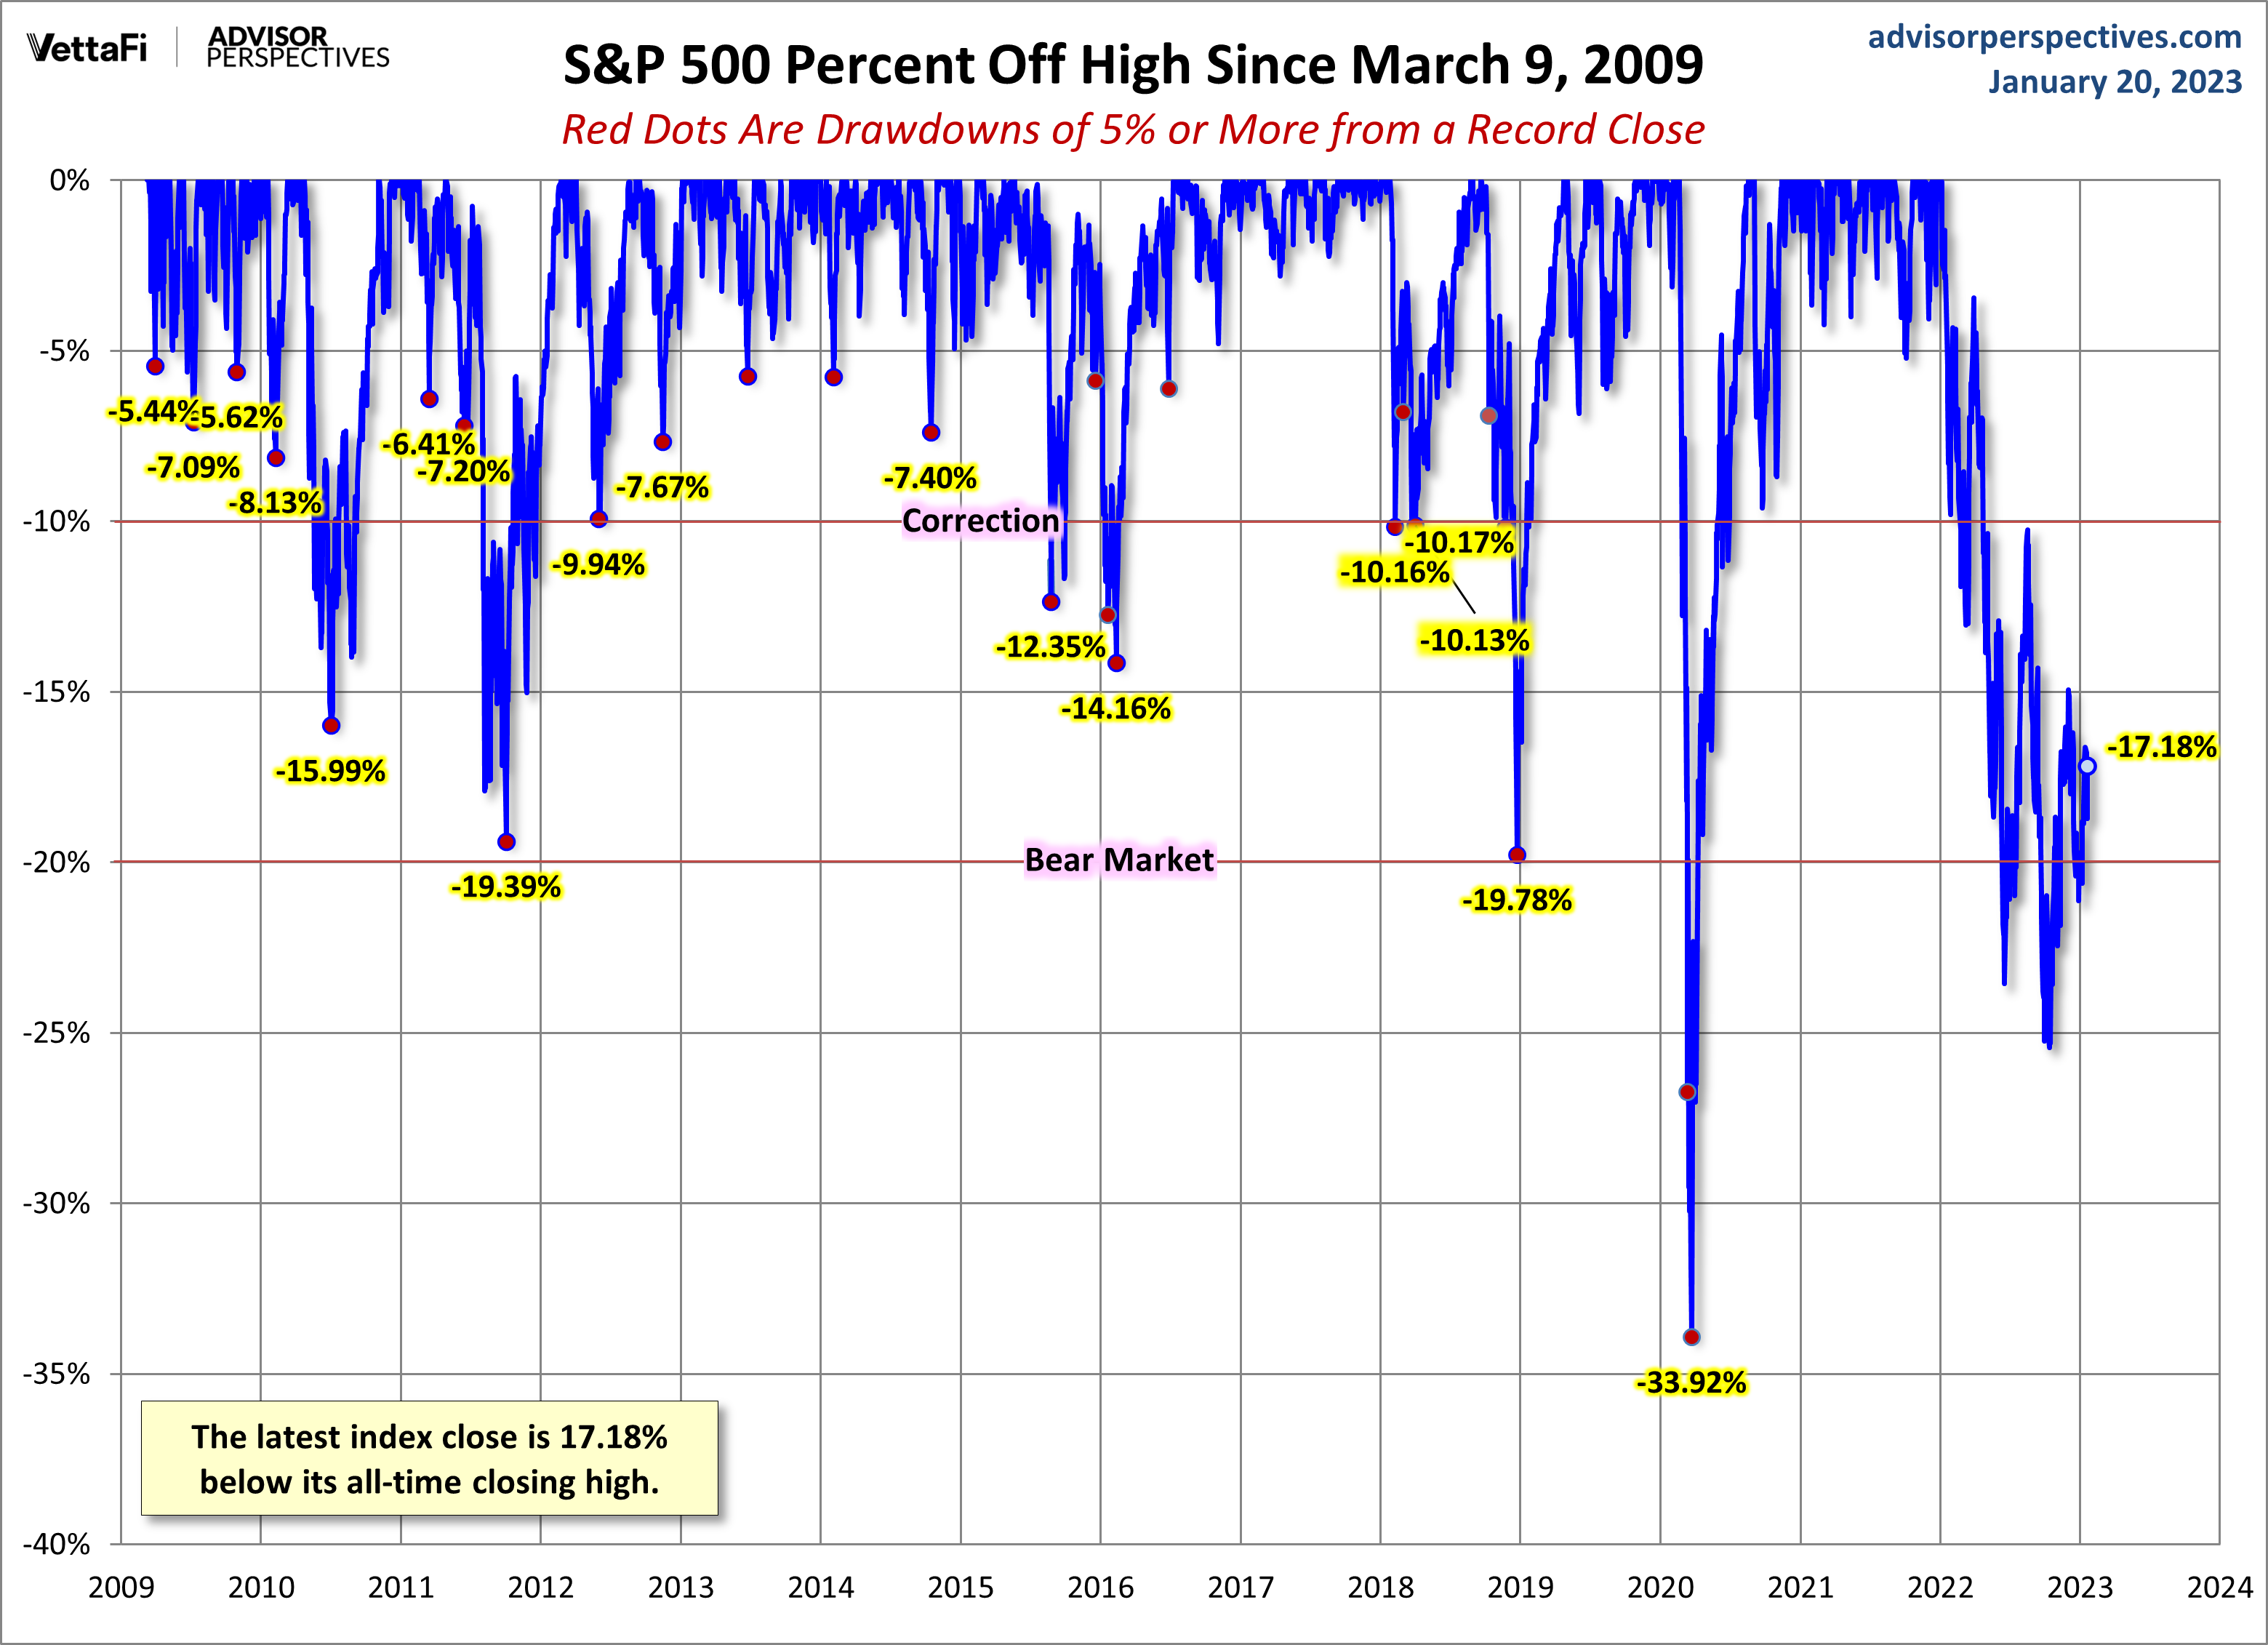
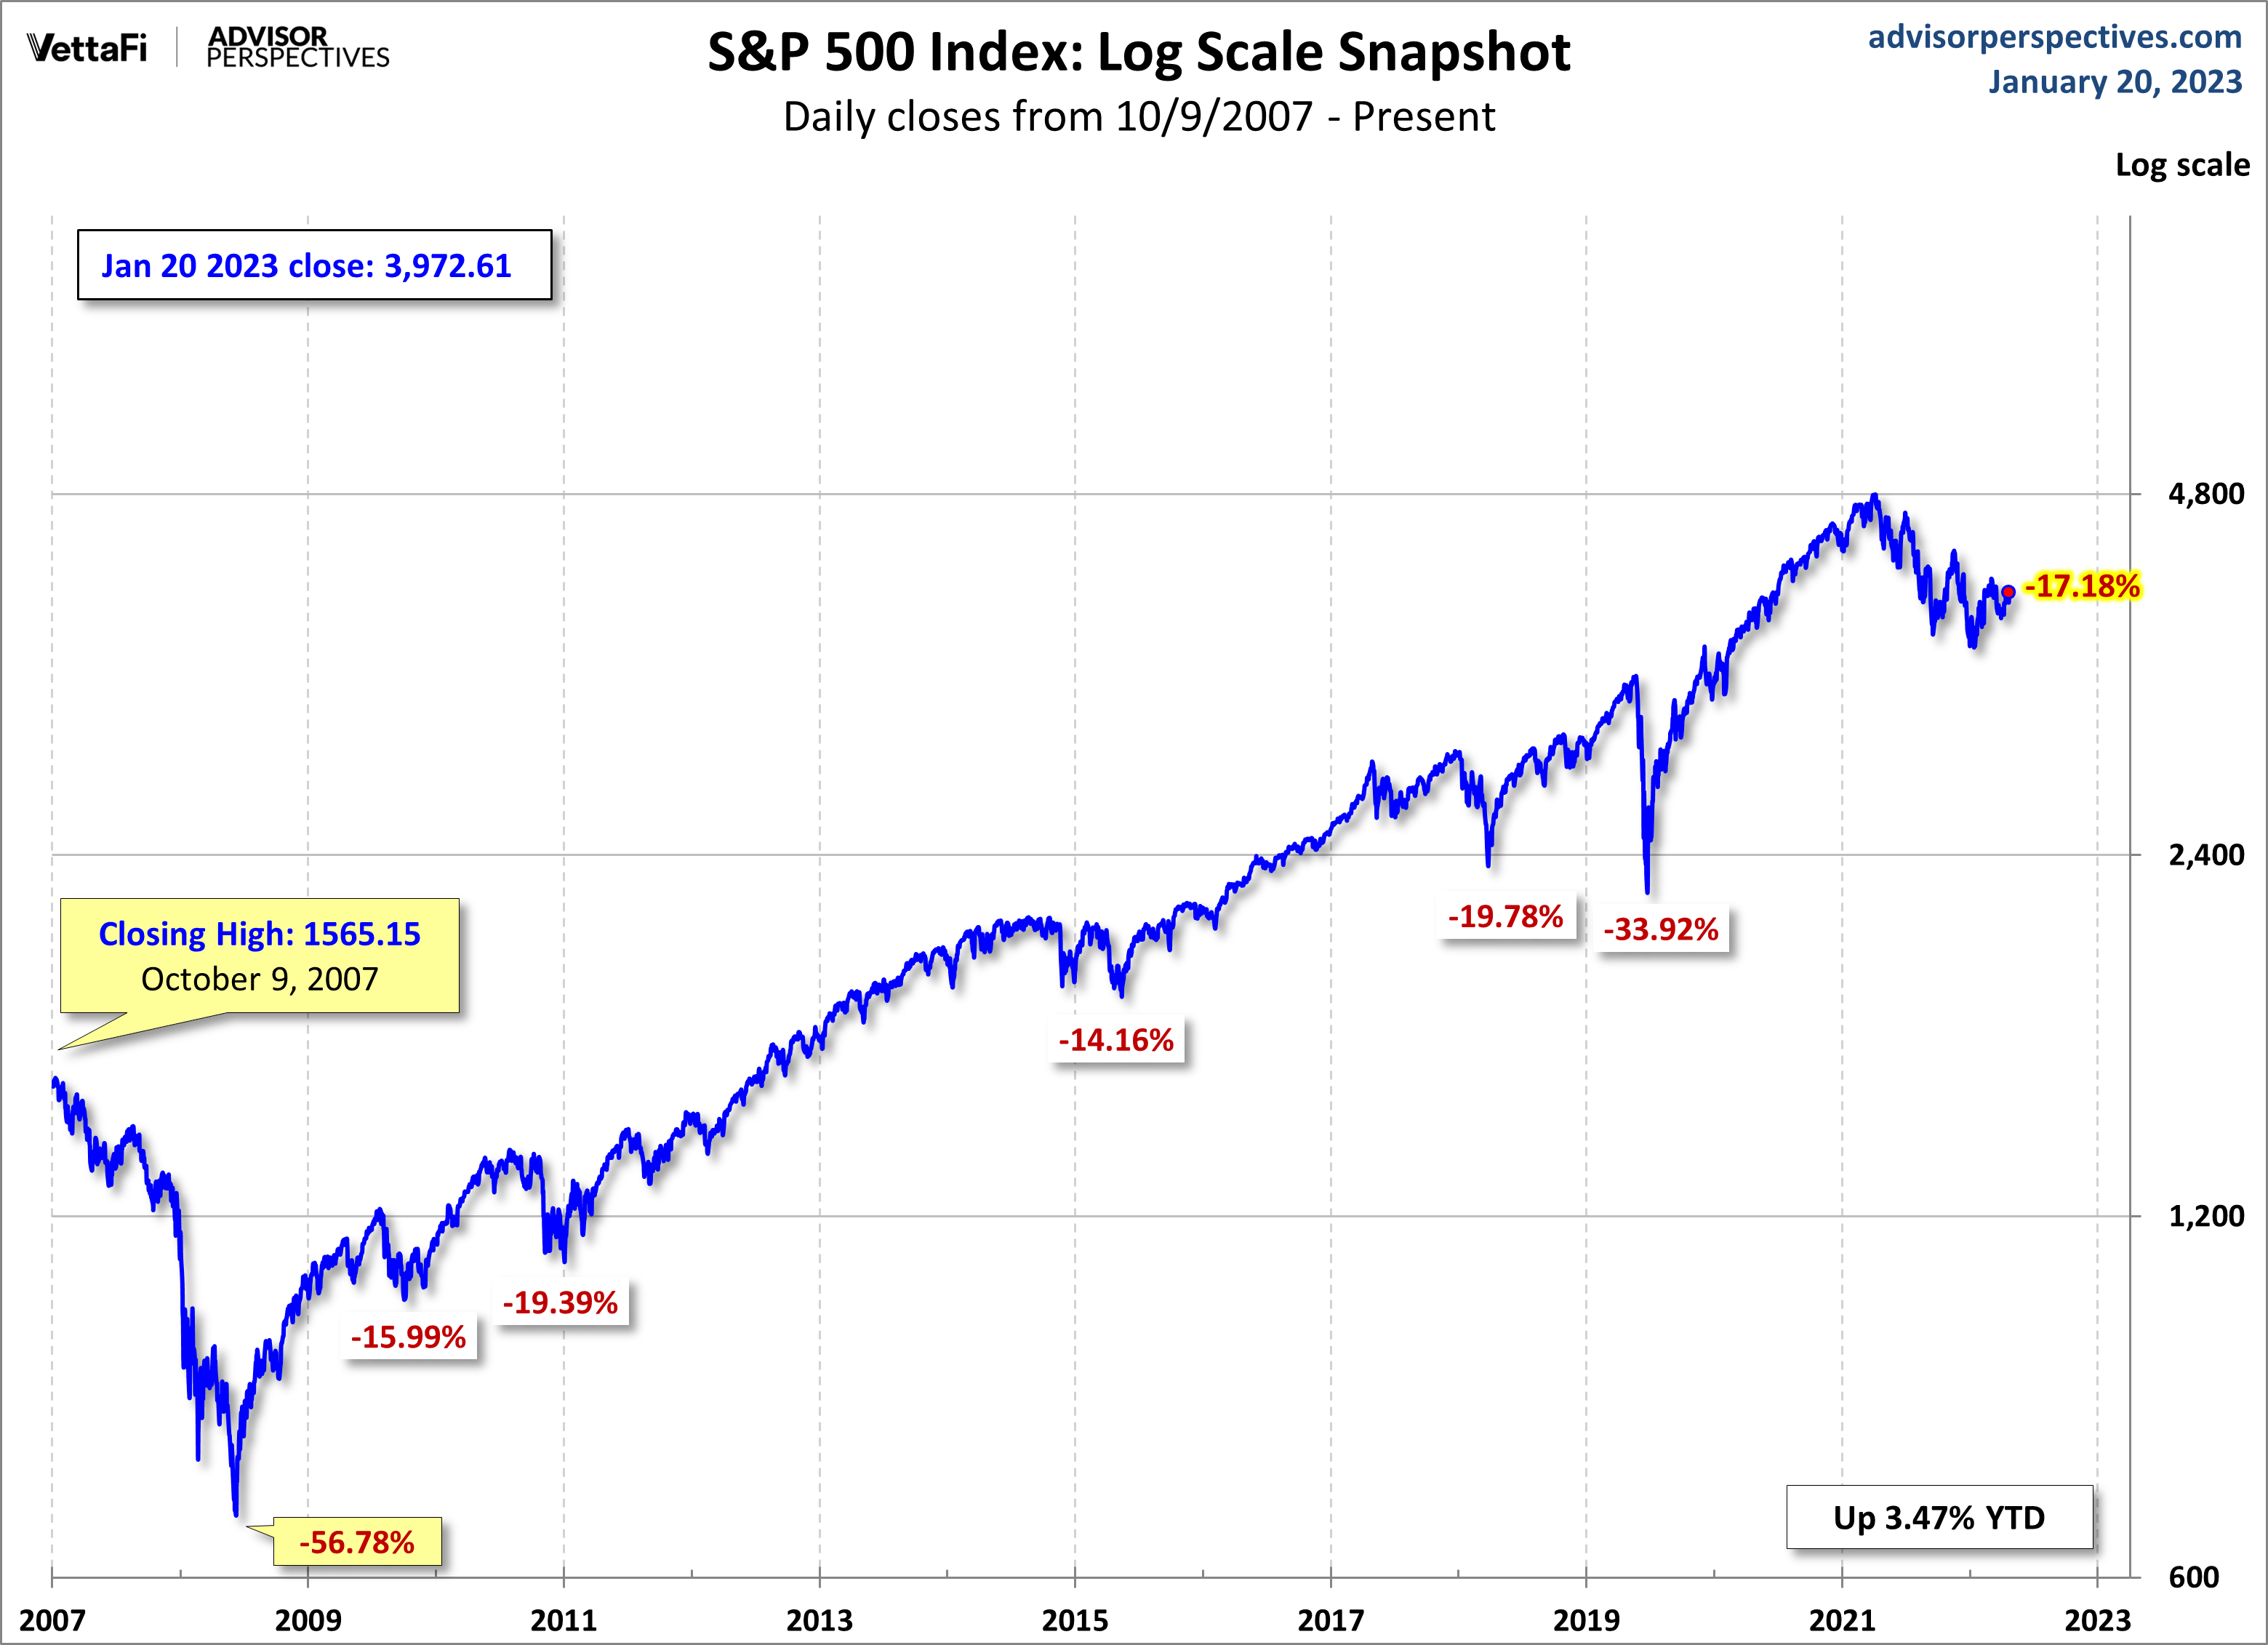
The S&P 500 rebounded on Friday, however despite the rally it still closed the week down 0.7%. The index is up 3.47% YTD and is still 17.18% below its record close.

The U.S. Treasury put the closing yield on the 10-year note, as of January 20, at 3.48% which is above its record low (0.52% on 8/4/2020). The 2-year note is at 4.14%. See our latest Treasury Snapshot here.

Here's a snapshot of the index going back to 2012.
A perspective on drawdowns
Here's a snapshot of record highs and selloffs since the 2009 trough. Note the recent selloffs in 2022.
(Click on image to enlarge)
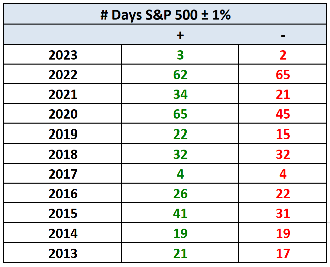
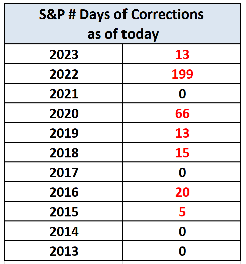
Here's a table with the number of days of a 1% or greater change in either direction and the number of days of corrections (down 10% or more from the record high) going back to 2013.
Here is a more conventional log-scale chart with drawdowns highlighted:
(Click on image to enlarge)
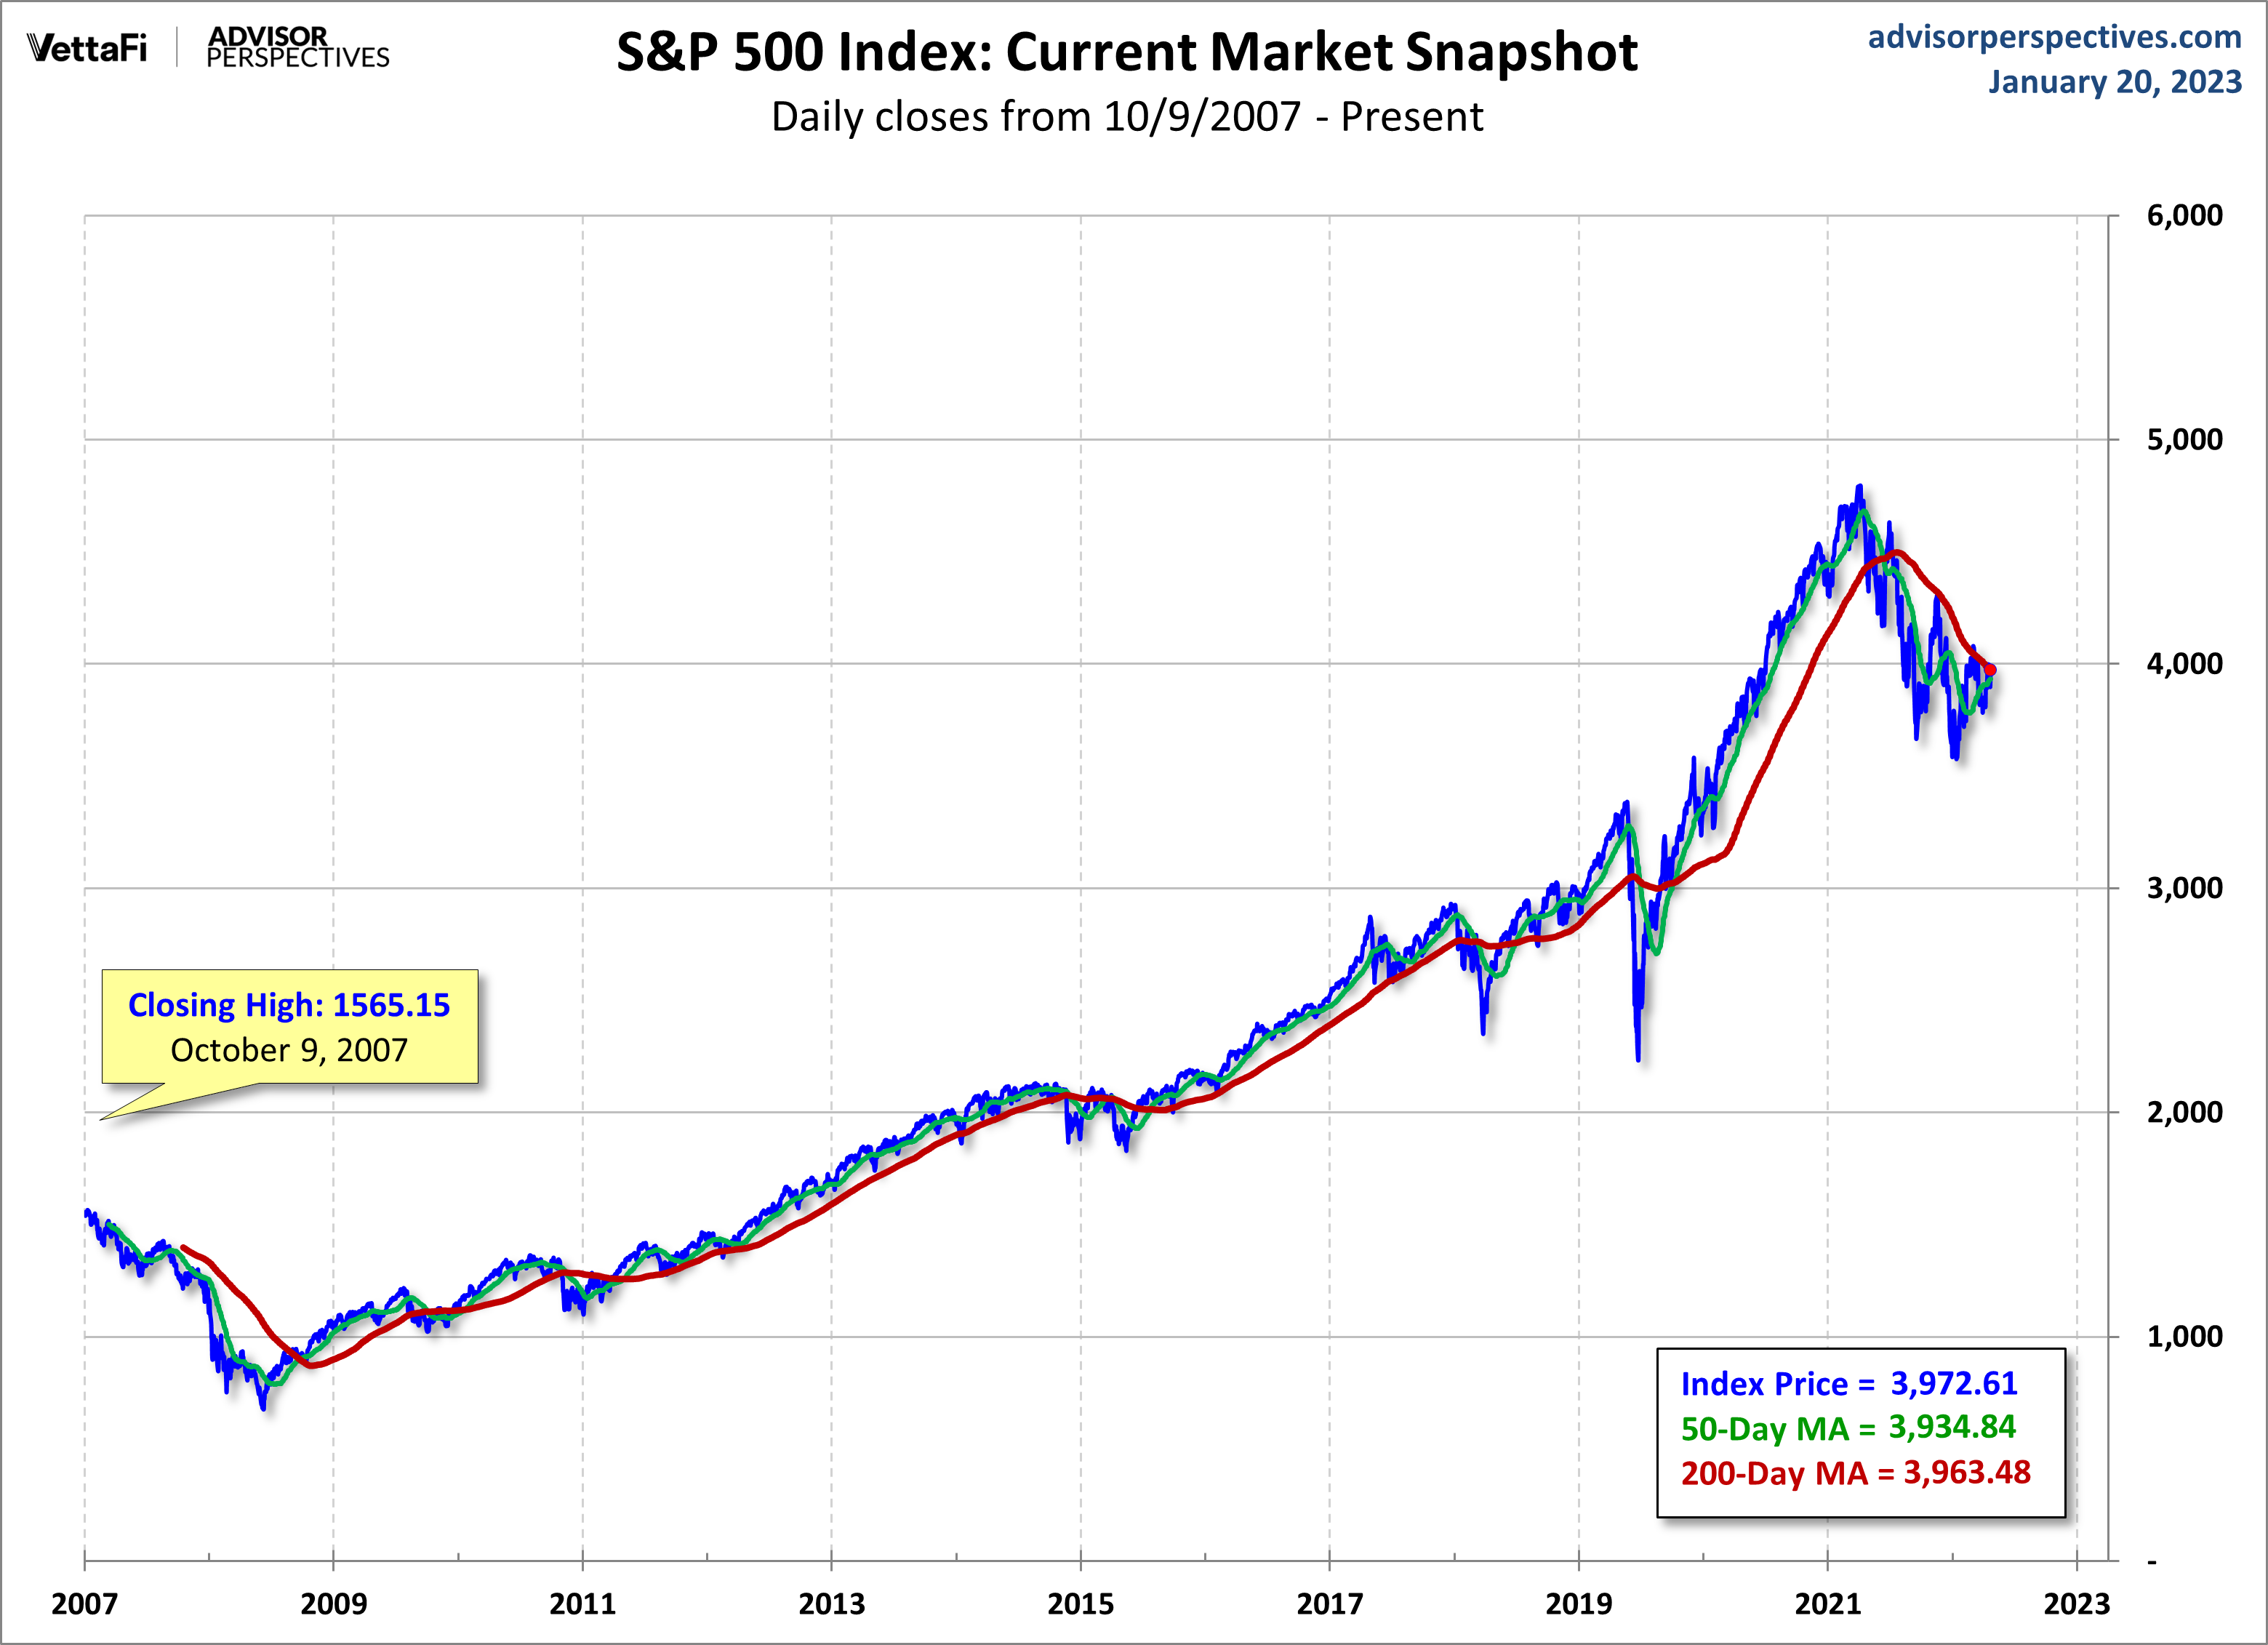
Here is a linearly scaled version of the same chart with the 50- and 200-day moving averages.
(Click on image to enlarge)
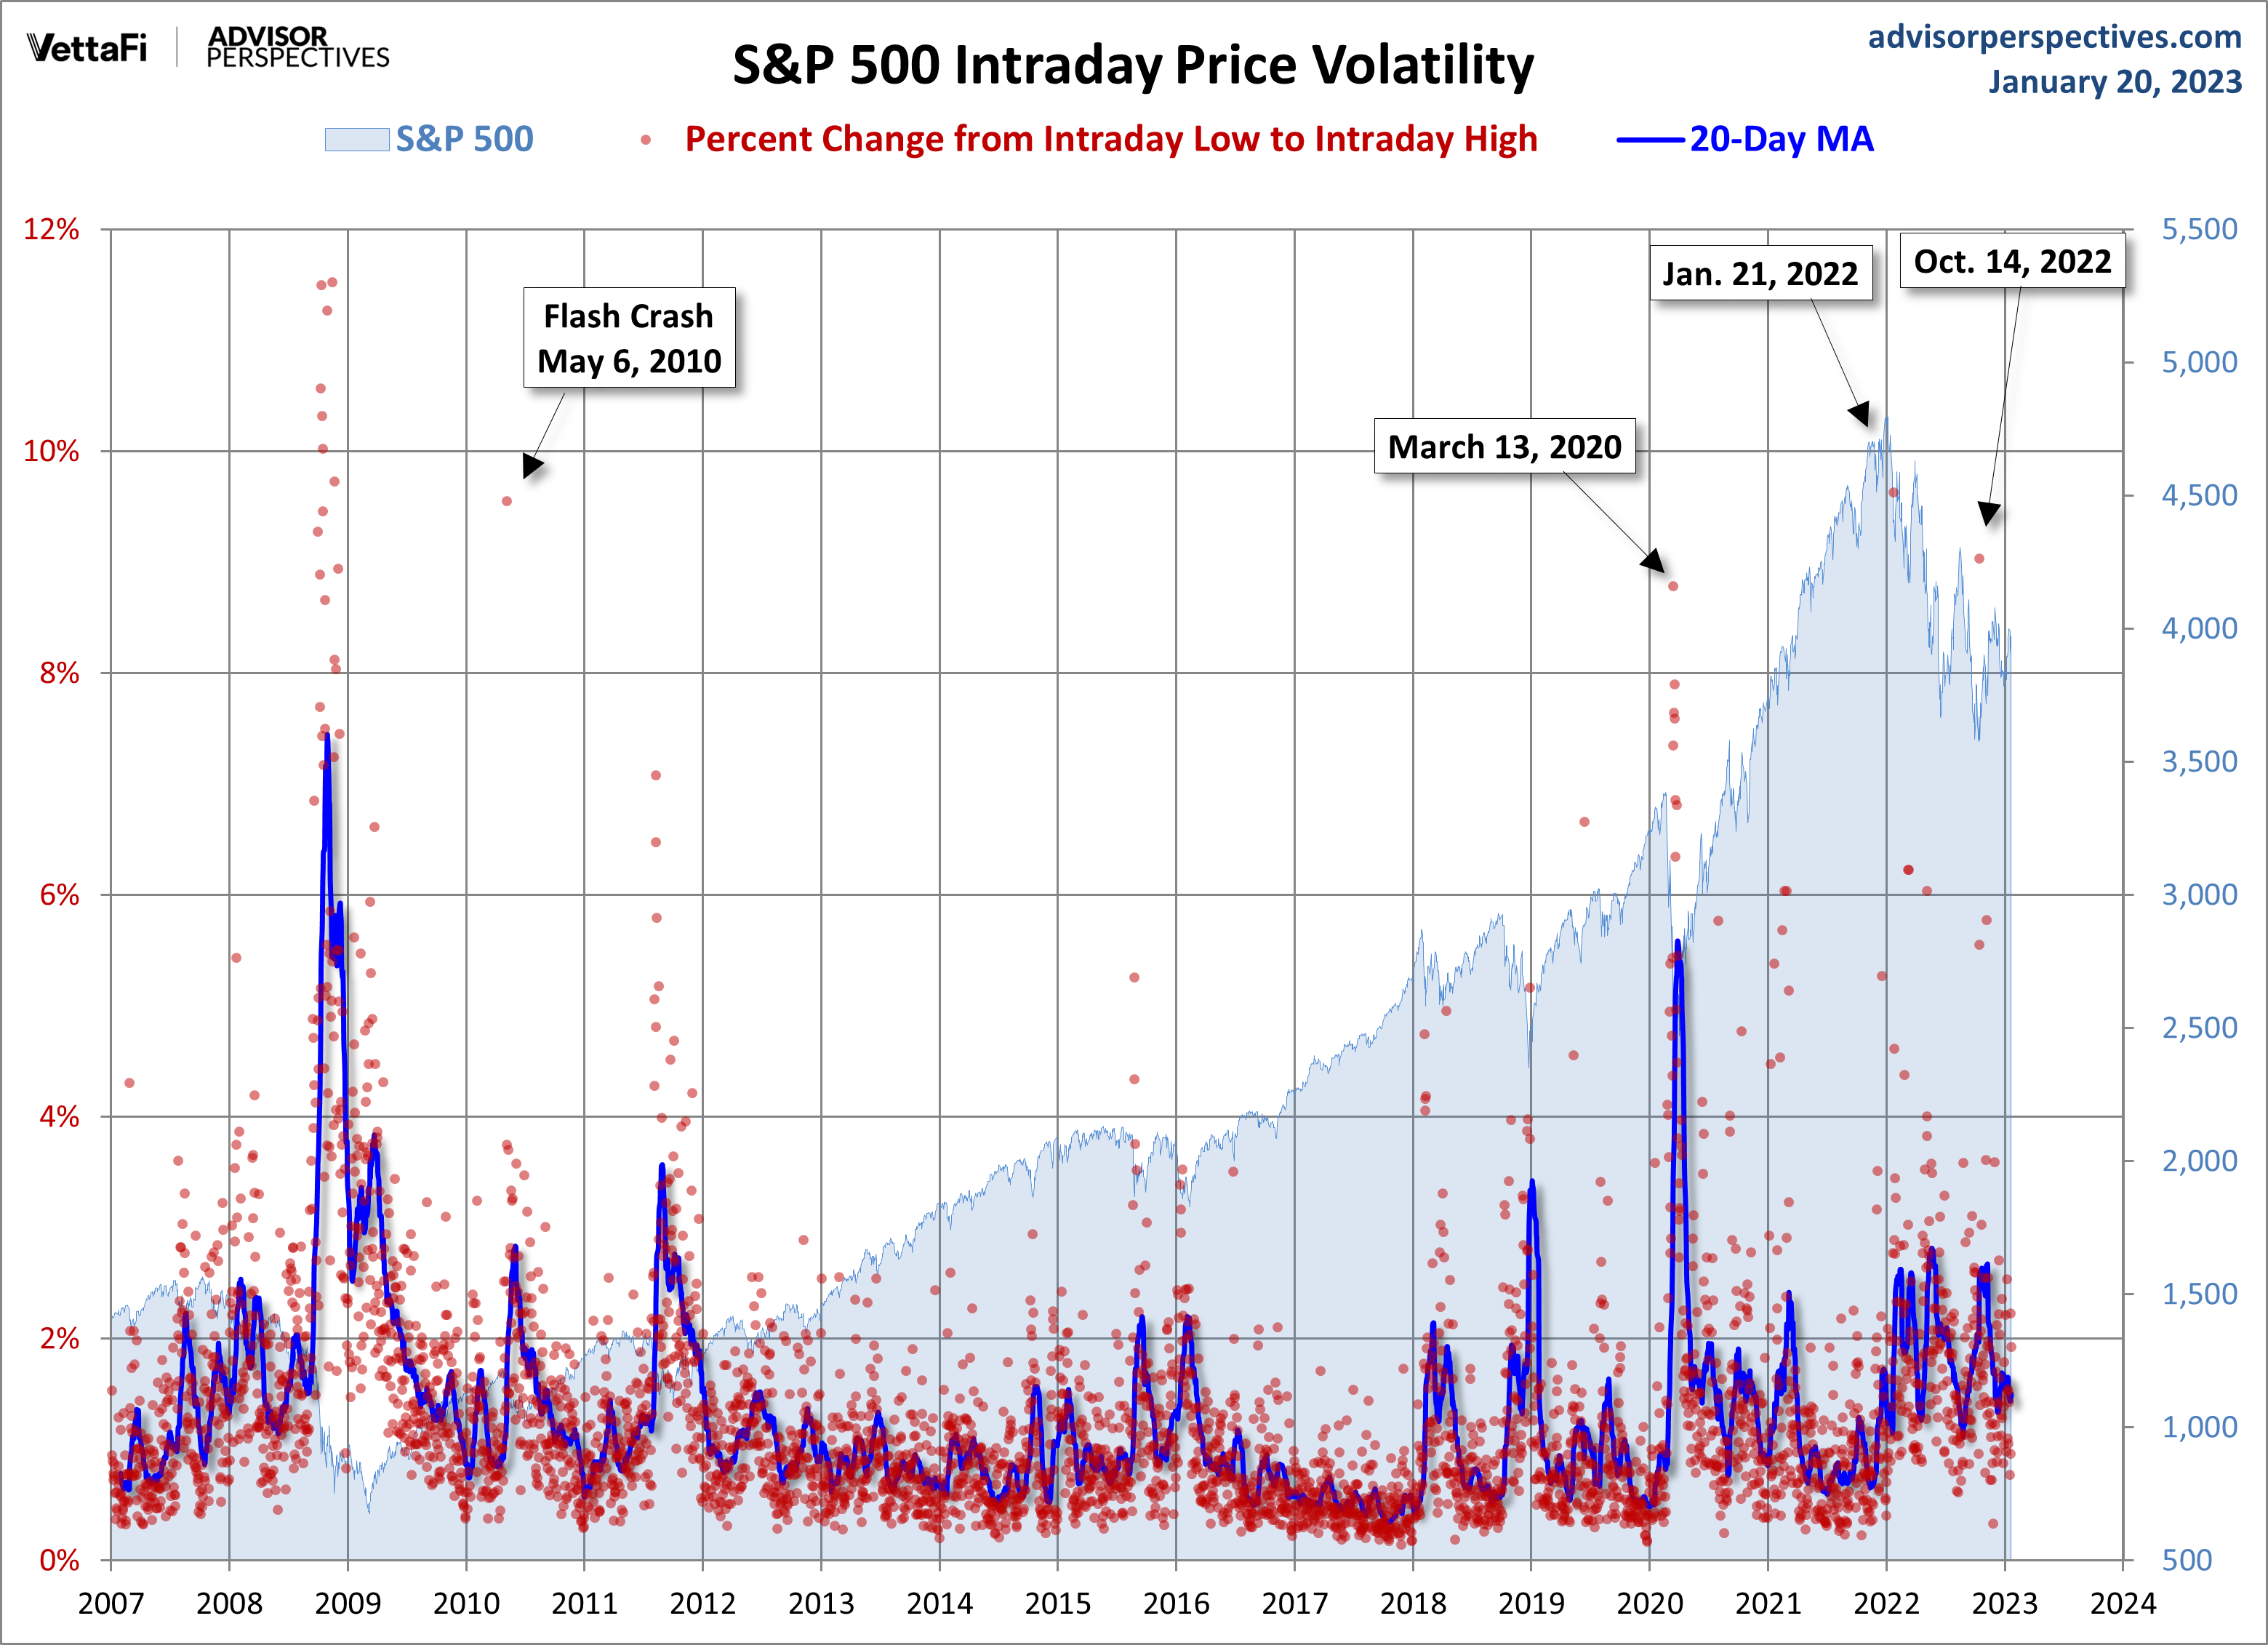
A perspective on volatility
For a sense of the correlation between the closing price and intraday volatility, the chart below overlays the S&P 500 since 2007 with the intraday price range. I've also included a 20-day moving average to identify trends in volatility.
(Click on image to enlarge)
More By This Author:
Middle-Class Hourly Wages As Of December 2022
Existing-Home Sales: Retreat For 11th Consecutive Month
New Residential Building Permits: Down 1.55% In December


Comments
Log in or sign up to join the conversation.