
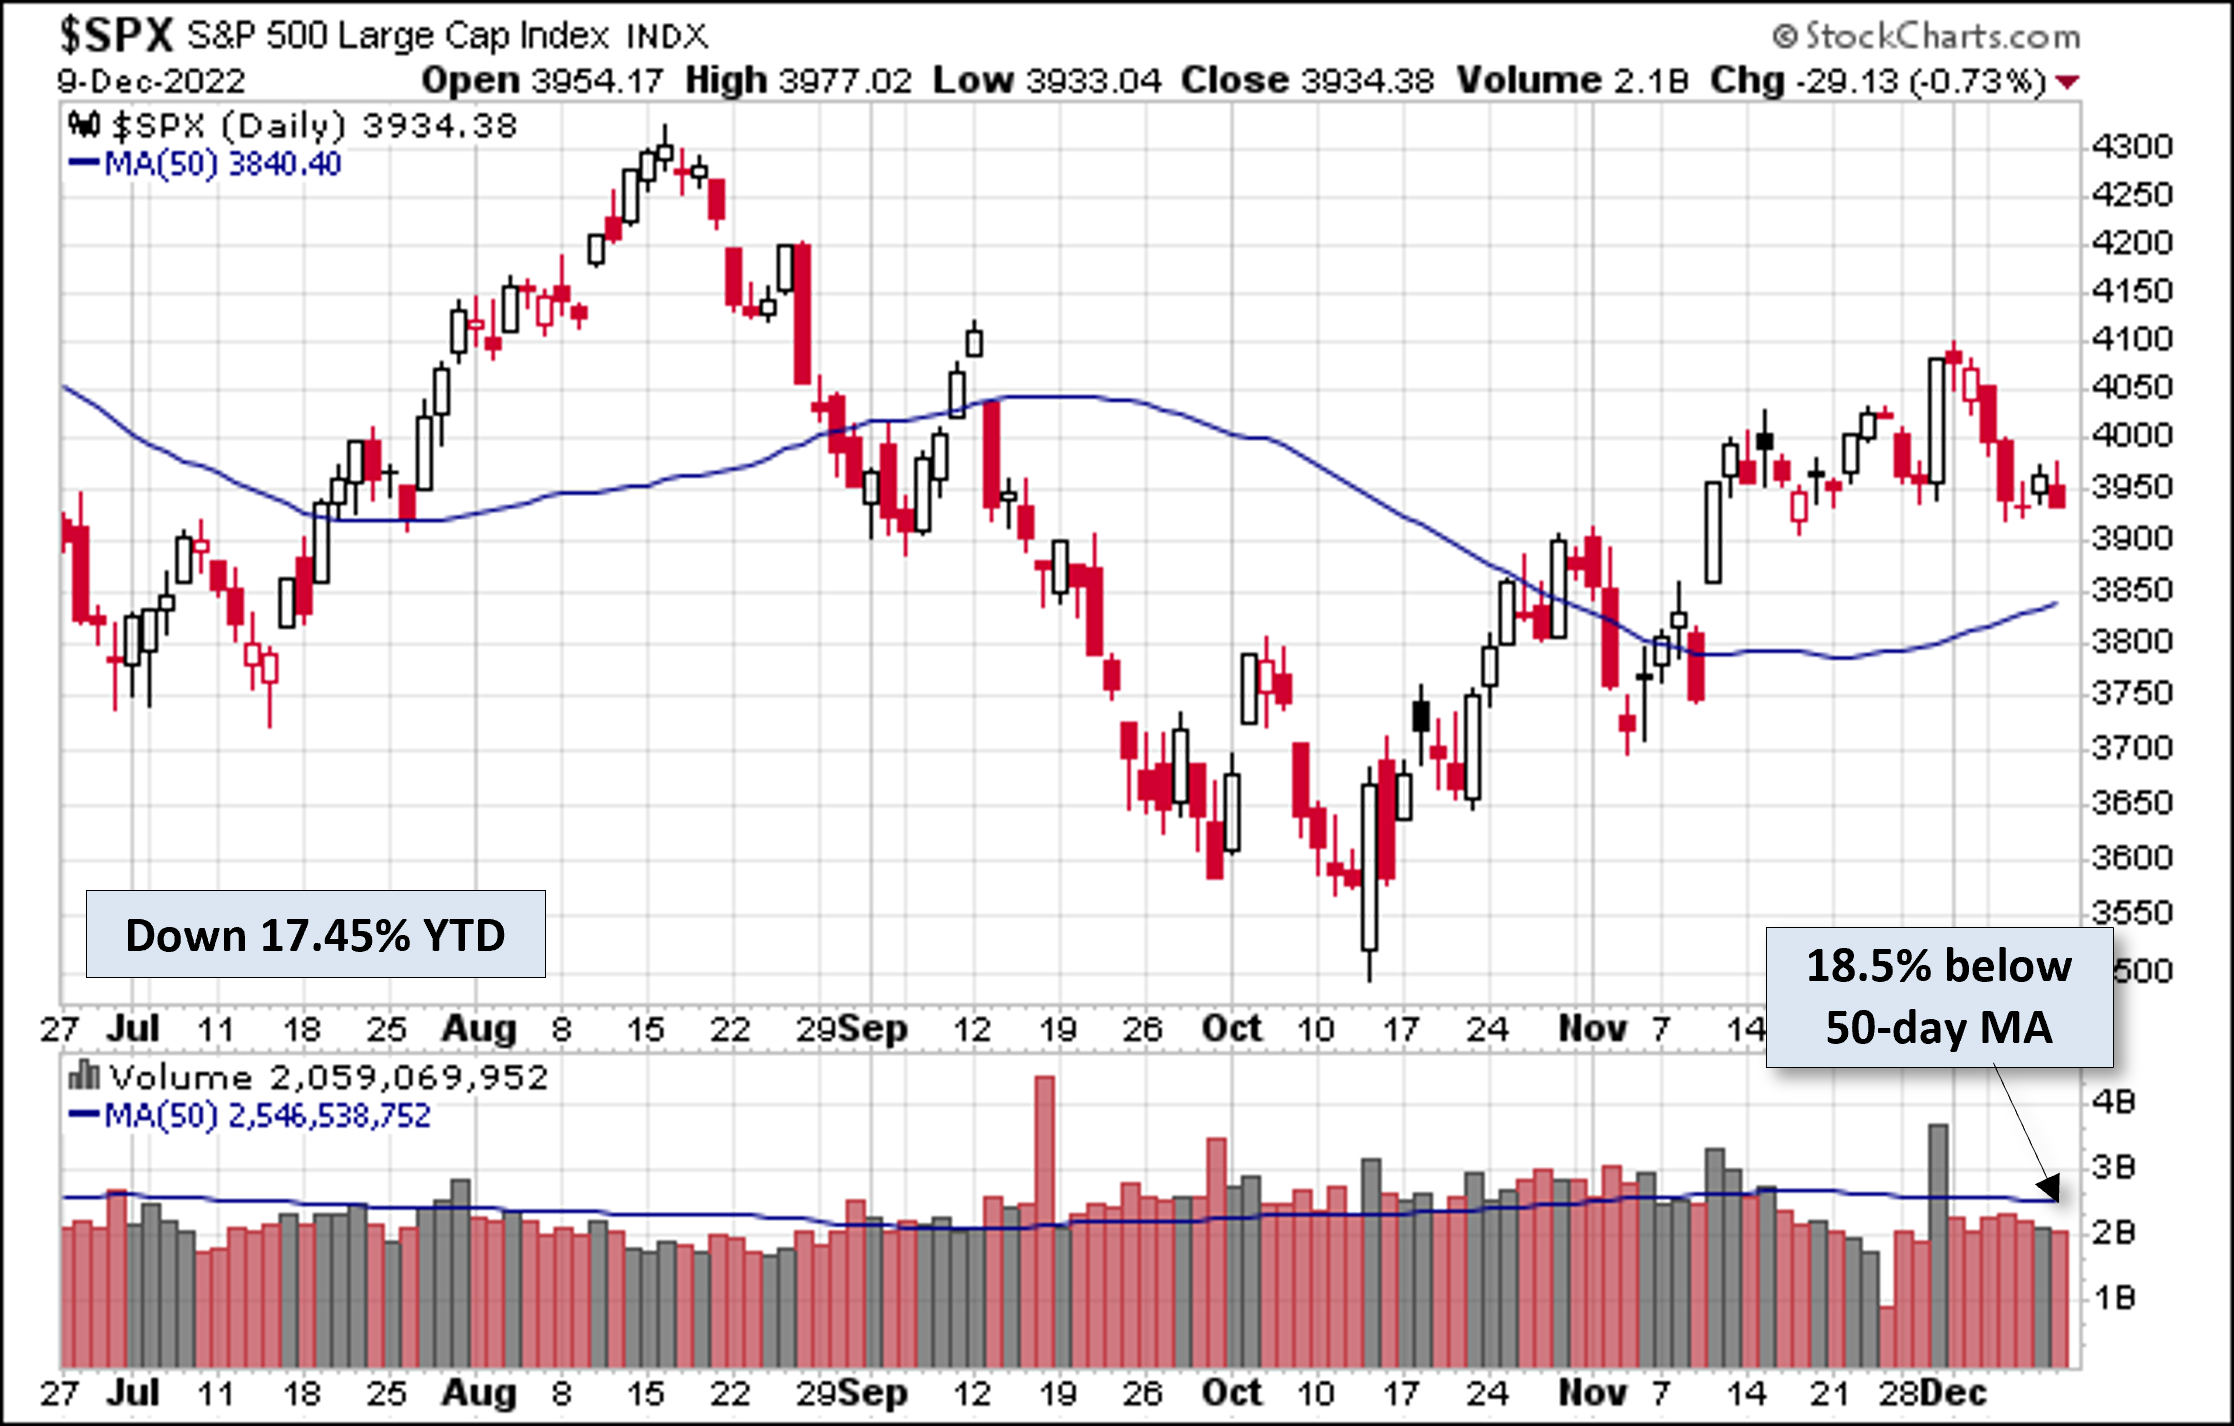
The S&P 500 fell Monday and Tuesday from its rally last week and petered around on Wednesday, ending the week mostly flat, then falling at close on Friday. The index is about 18% below its record close and is down 17.5% YTD.

The U.S. Treasury puts the closing yield on the 10-year note as of December 9 at 3.57% which is above its record low (0.52% on 8/4/2020). The 2-year note is at 4.33%. See our latest Treasury Snapshot here.
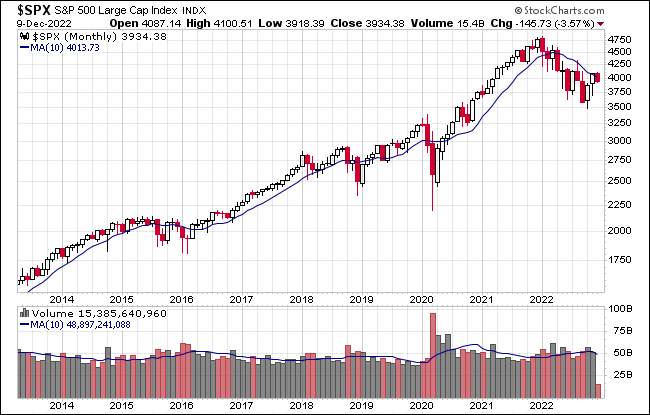
Here's a snapshot of the index going back to 2012.
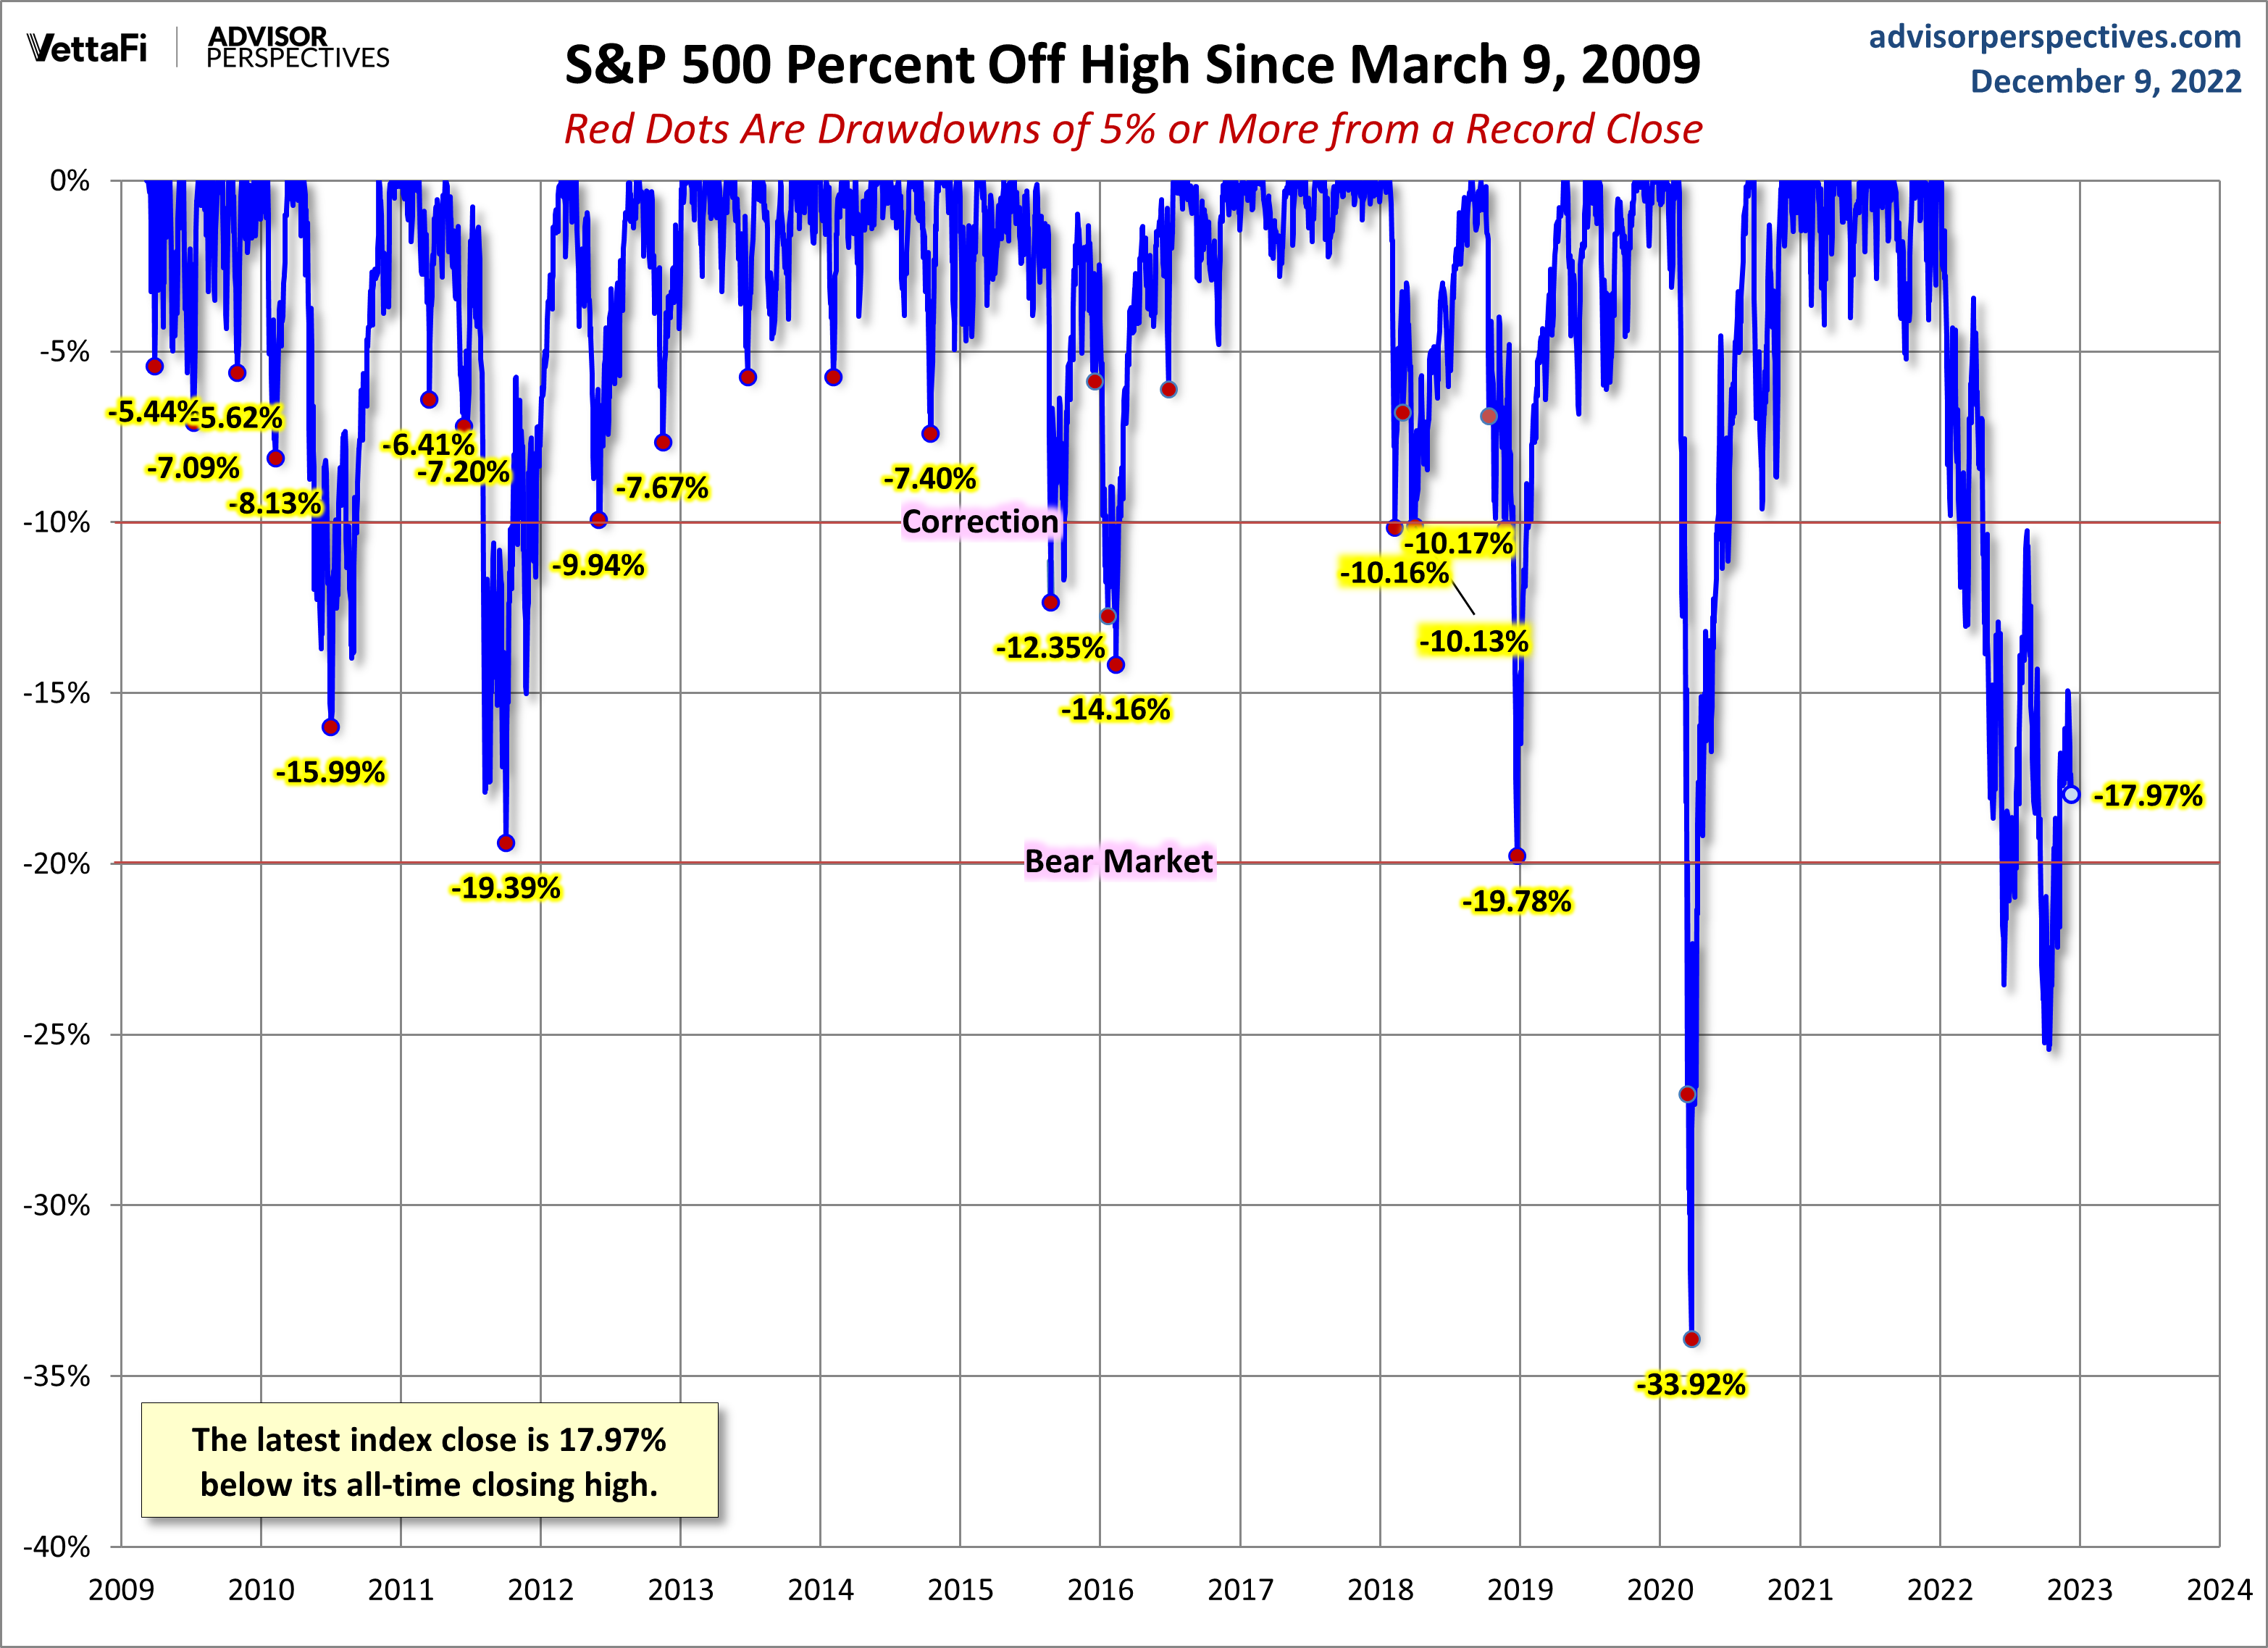
A Perspective on Drawdowns
Here's a snapshot of record highs and selloffs since the 2009 trough. Note the recent selloffs in 2022.
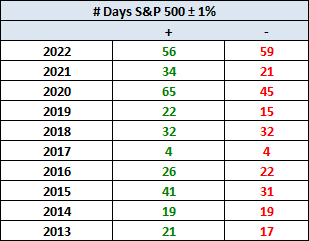
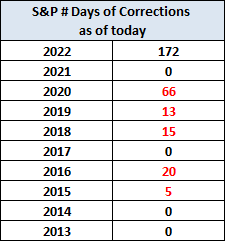
Here's a table with the number of days of a 1% or more change in either direction and the number of days of corrections (down 10% or more from the record high) going back to 2013.
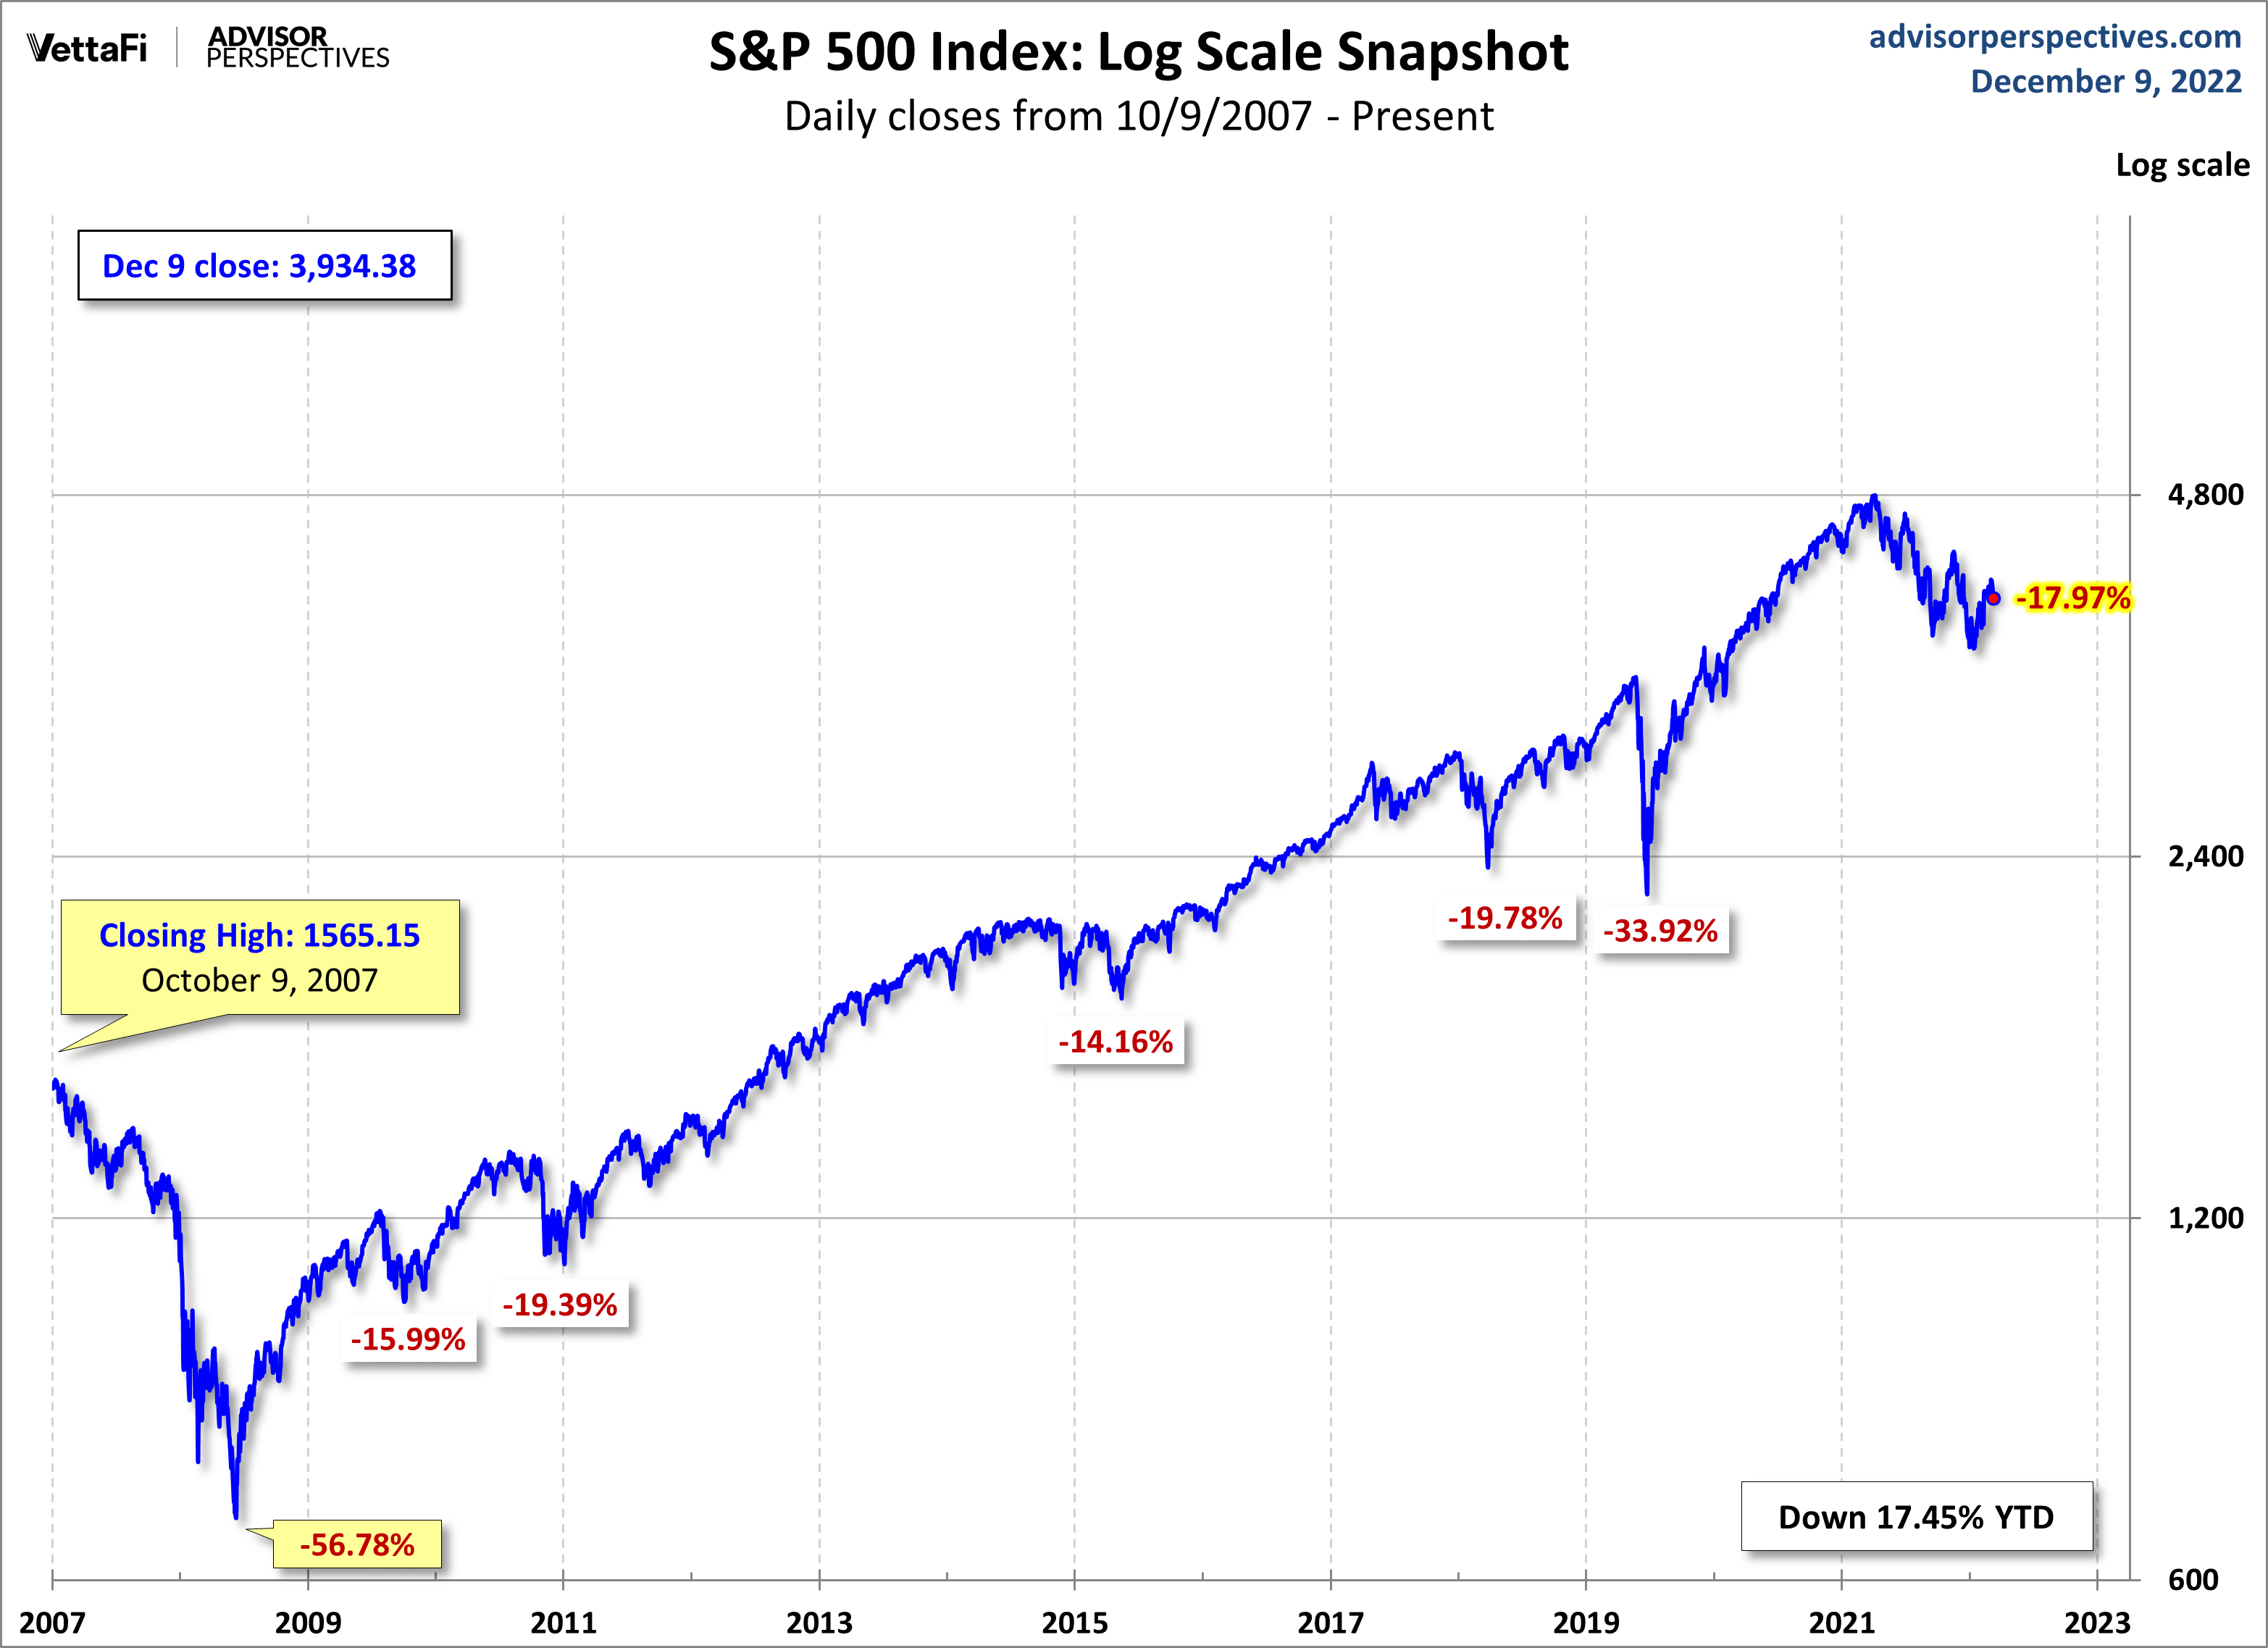
Here is a more conventional log-scale chart with drawdowns highlighted.
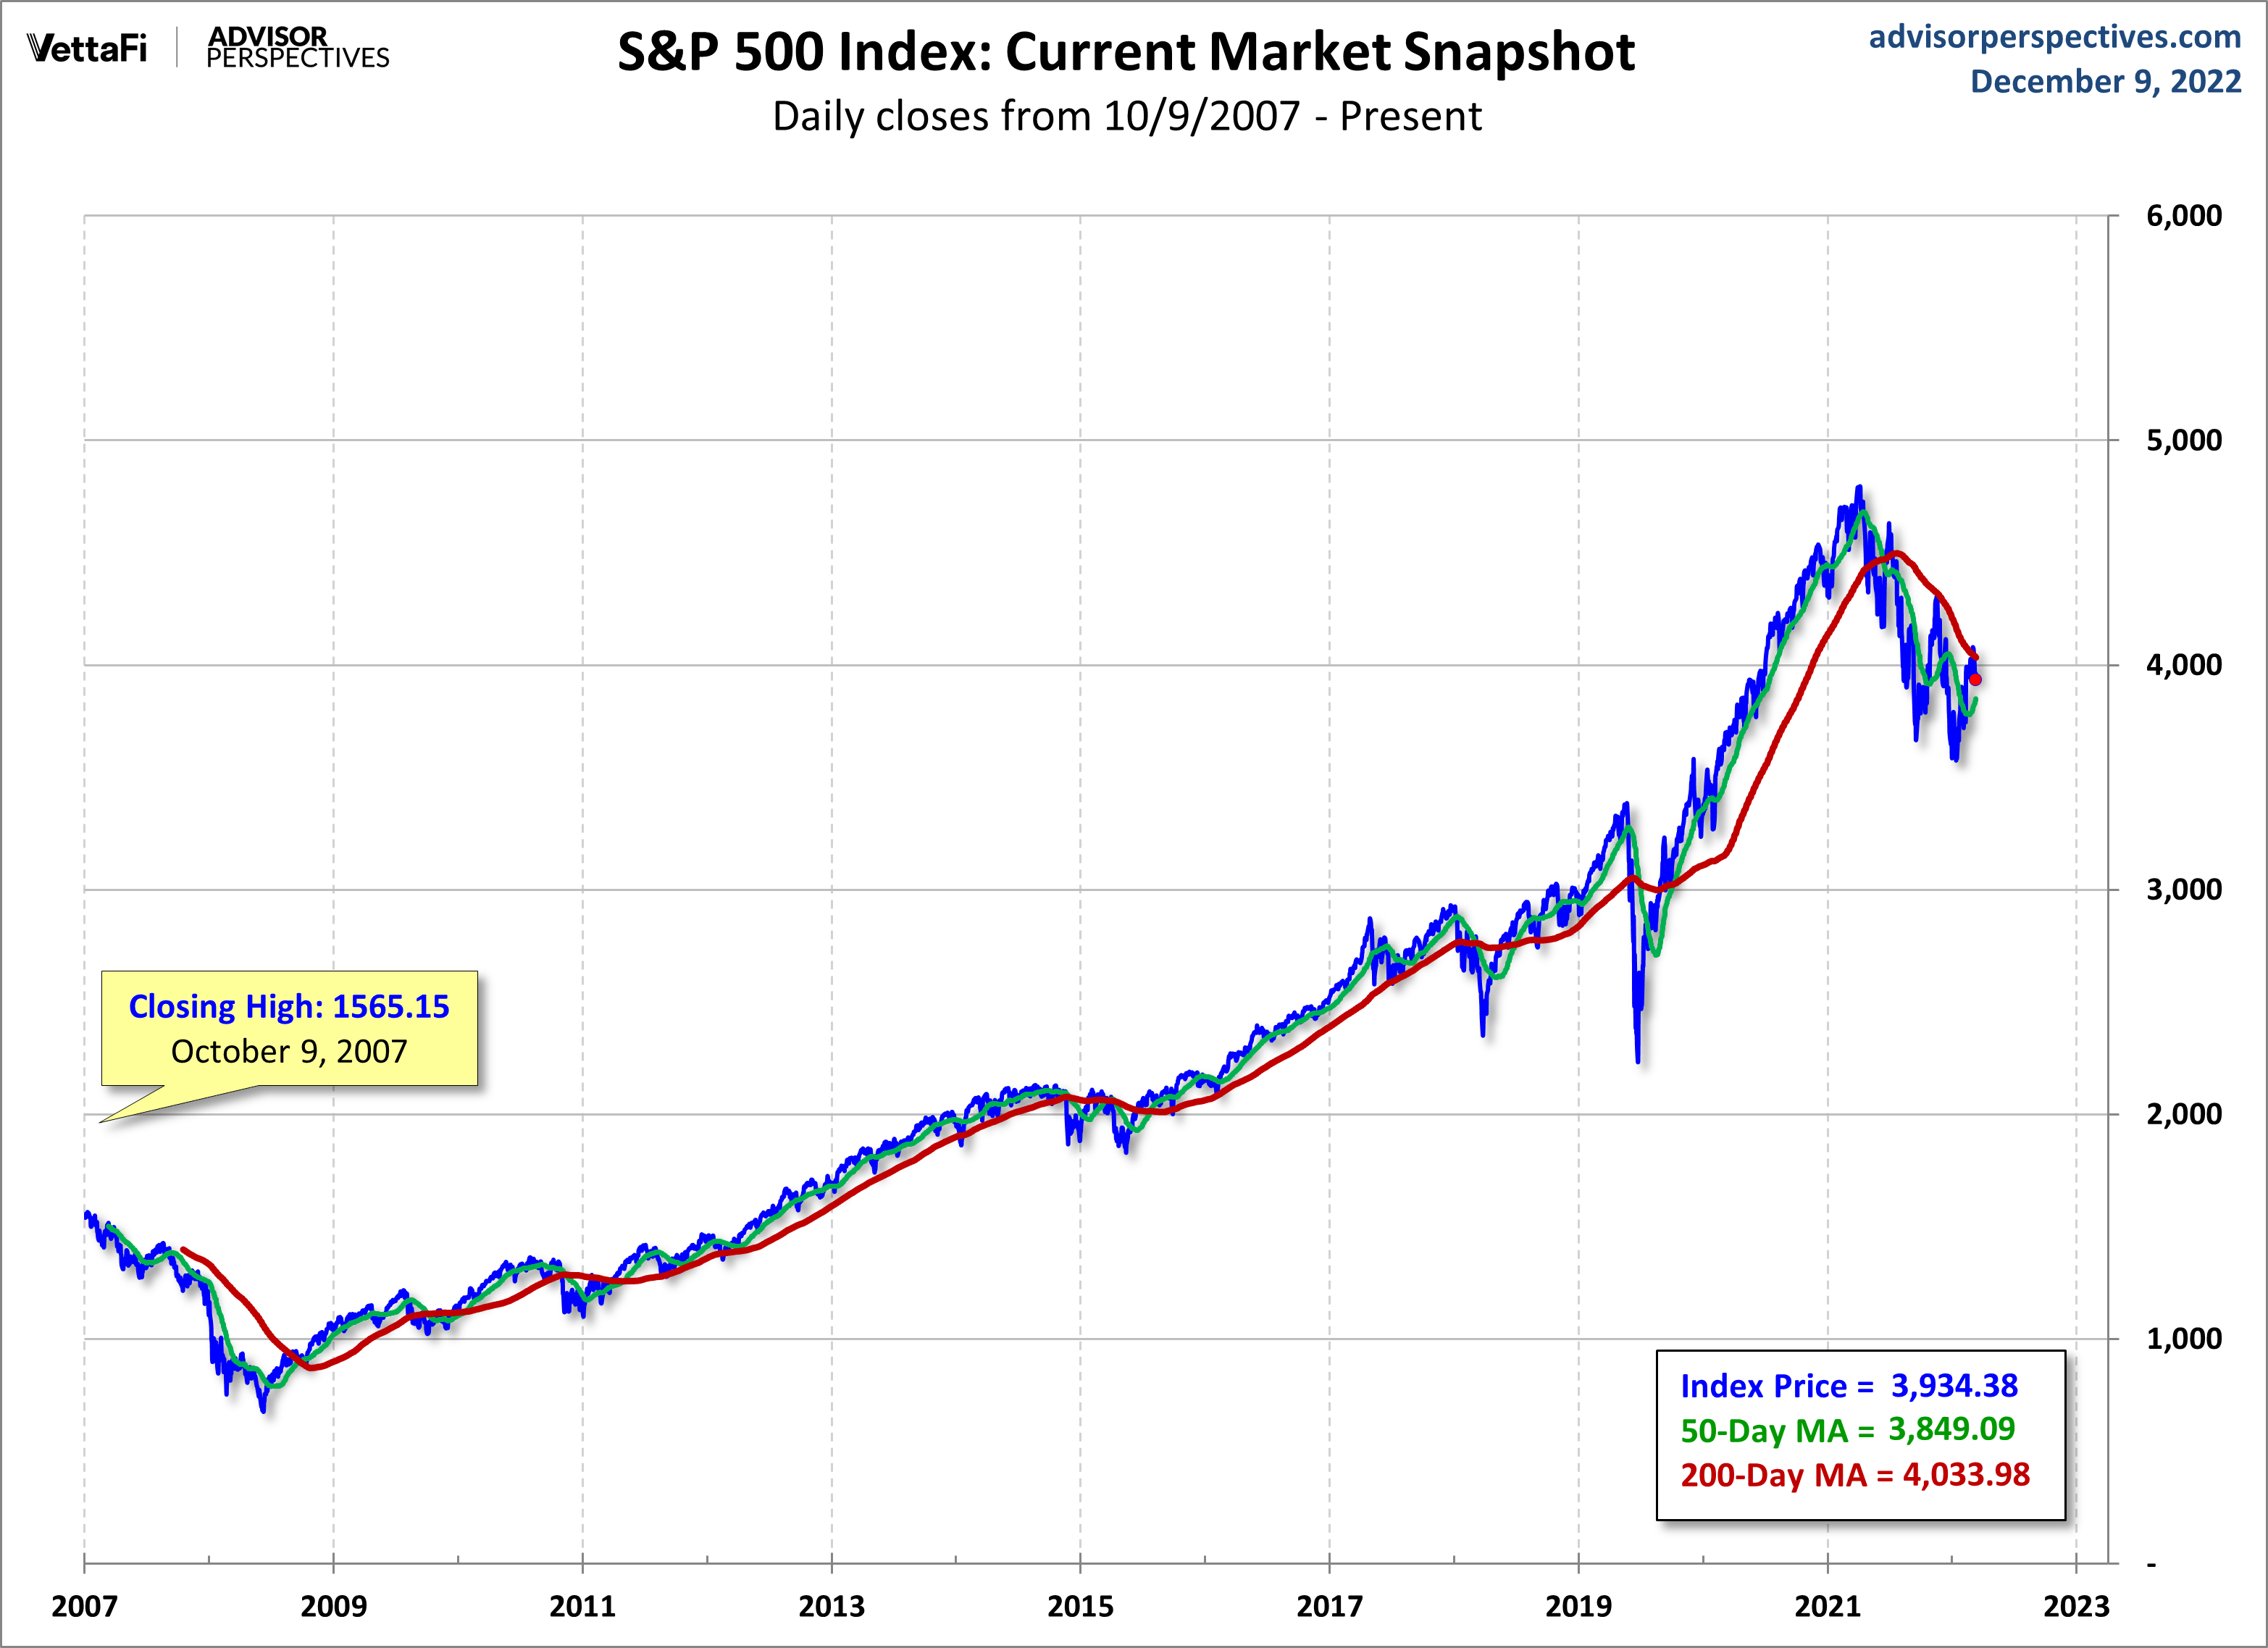
Here is a linear scale version of the same chart with the 50- and 200-day moving averages.
A Perspective on Volatility
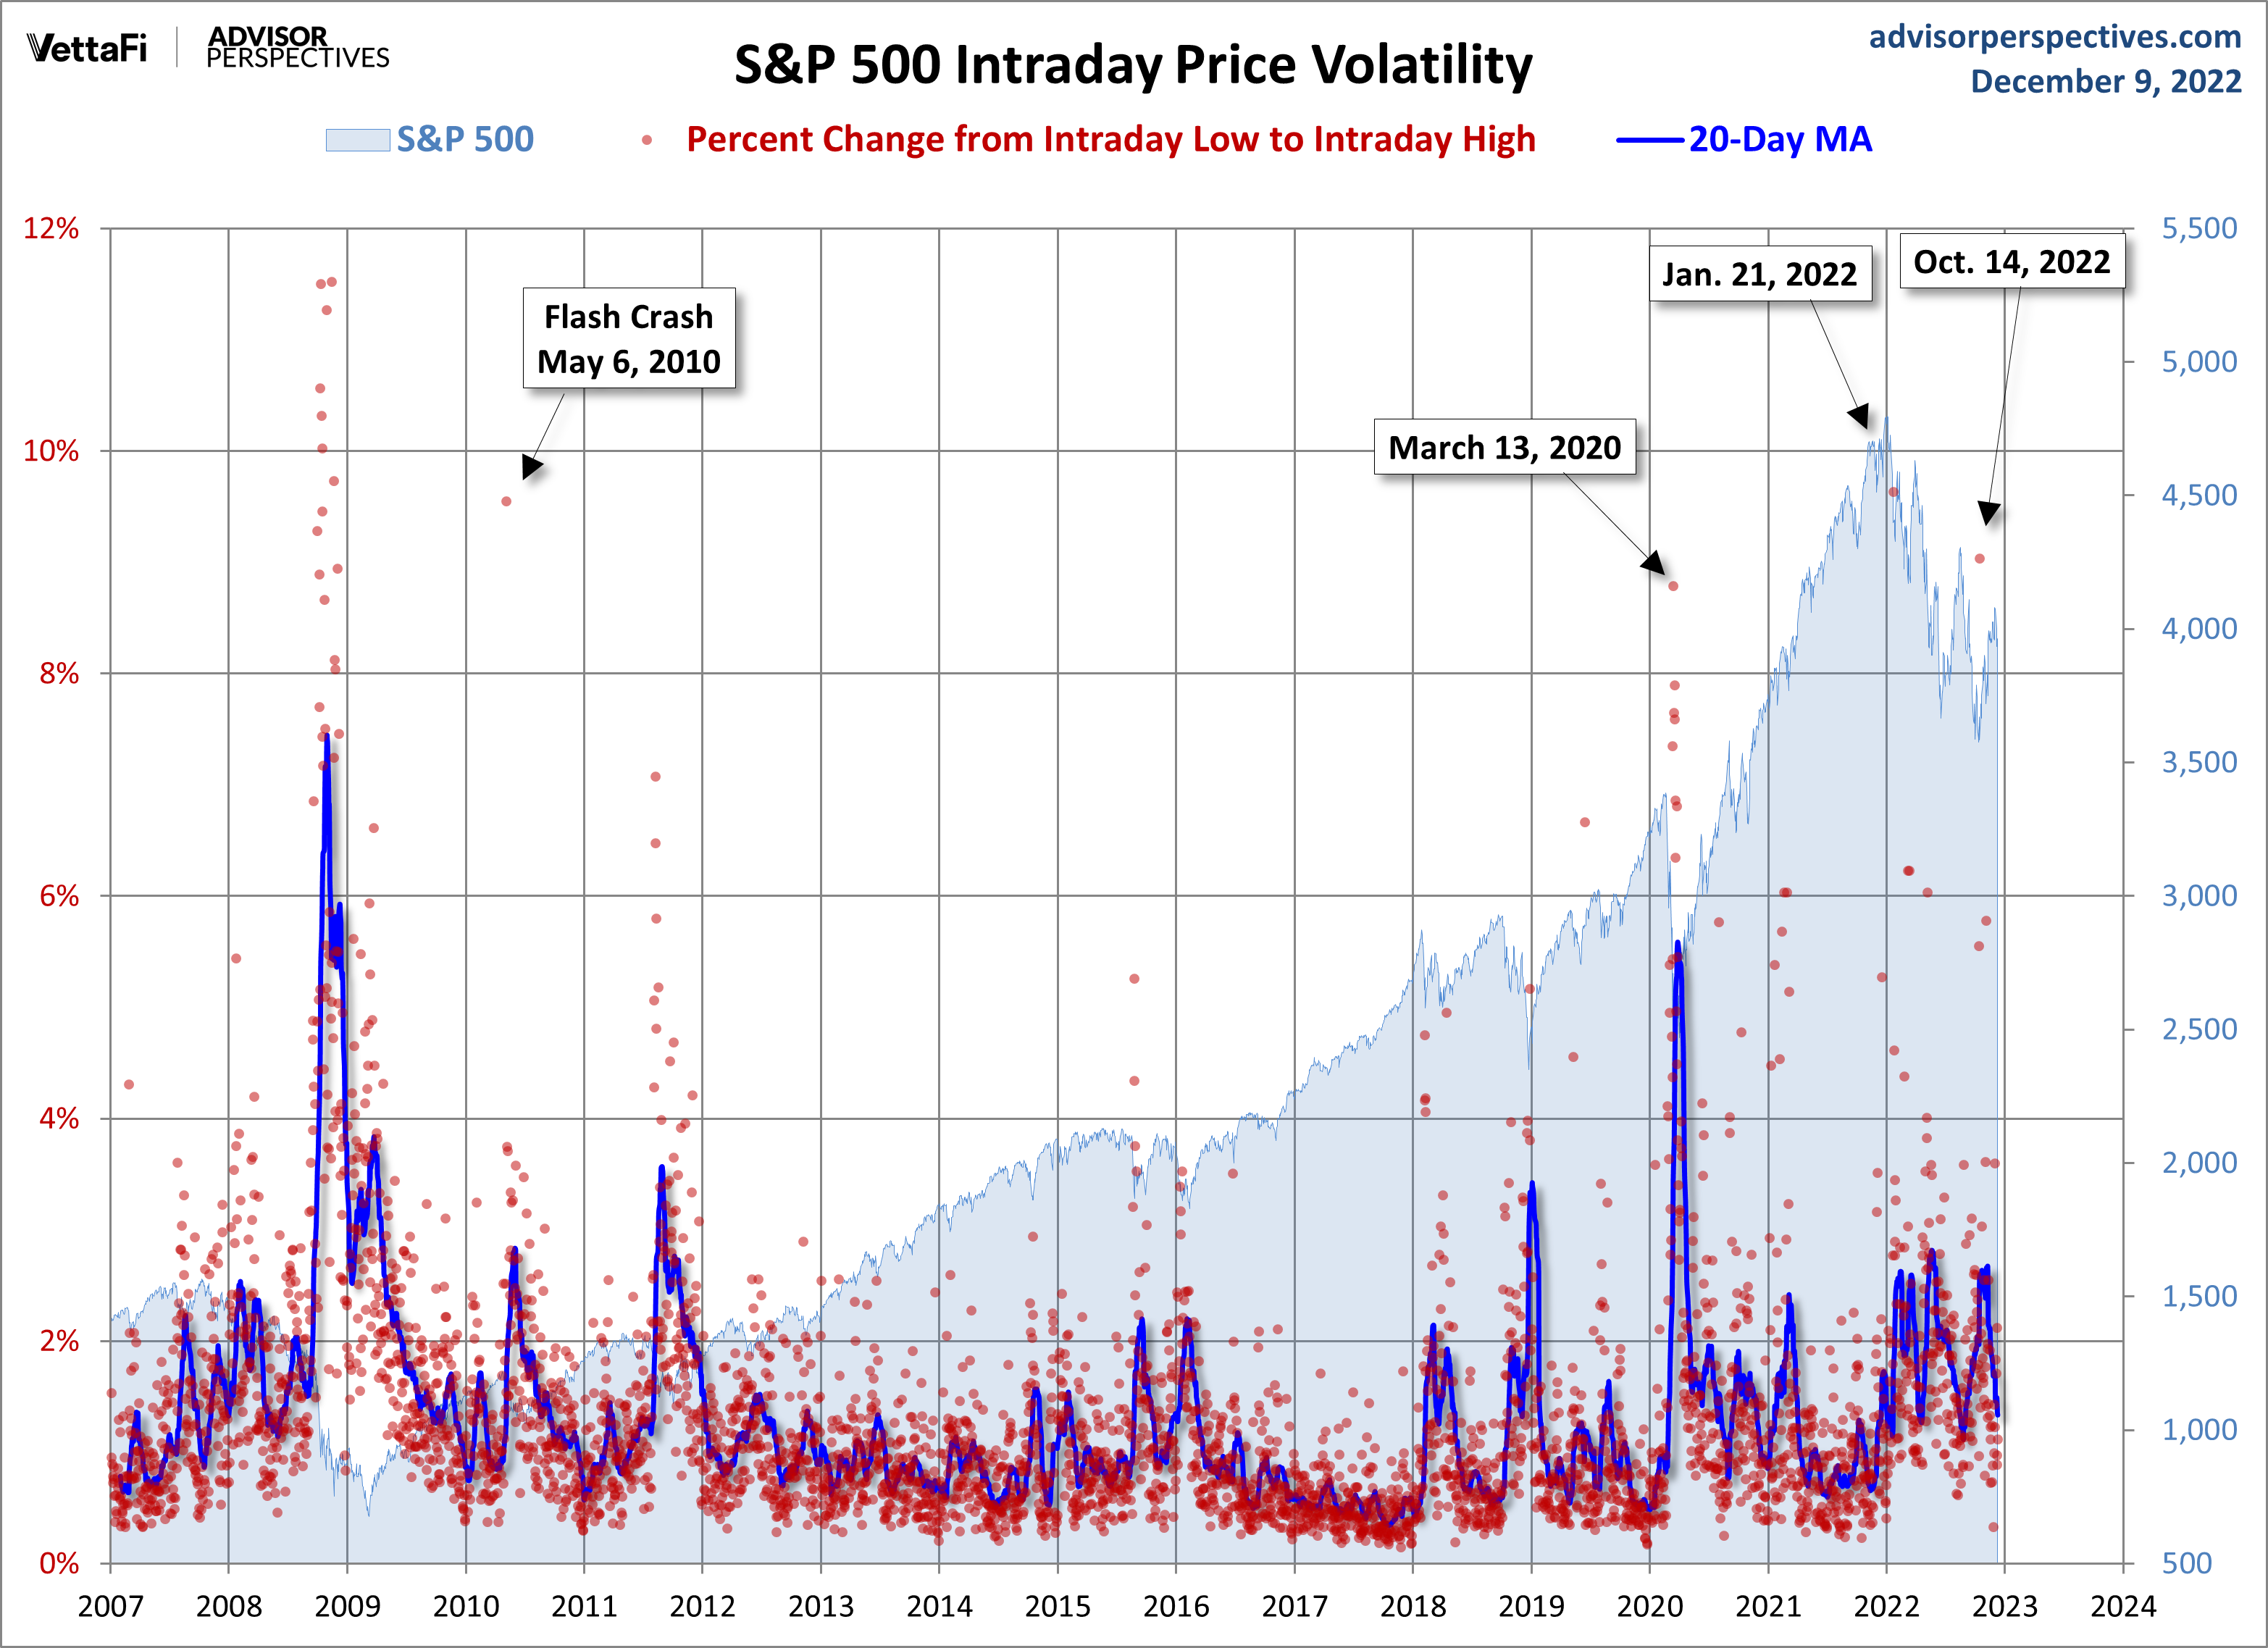
For a sense of the correlation between the closing price and intraday volatility, the chart below overlays the S&P 500 since 2007 with the intraday price range. We've also included a 20-day moving average to help identify trends in volatility.
More By This Author:
Michigan Consumer Sentiment Gains 4% In December, Beats Forecast
November Producer Price Index: Finished Goods At 10.6% YoY
Full-Time And Part-Time Employment: A Deeper Look - Friday, Dec. 9


Comments
Log in or sign up to join the conversation.