

Image Source: Pexels
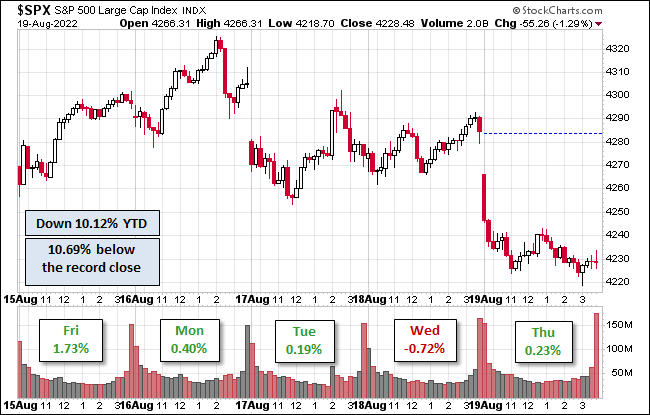
The S&P 500 bounced around this week, ending with gains four out of five days. The index is 10.69% below its record close and is down 10.12% year-to-date.
The U.S. Treasury puts the closing yield on the 10-year note as of Aug. 19 at 2.52%, which is above its record low (0.52% on Aug. 4, 2020). The 2-year note is at 3.49%. See our latest Treasury Snapshot here.
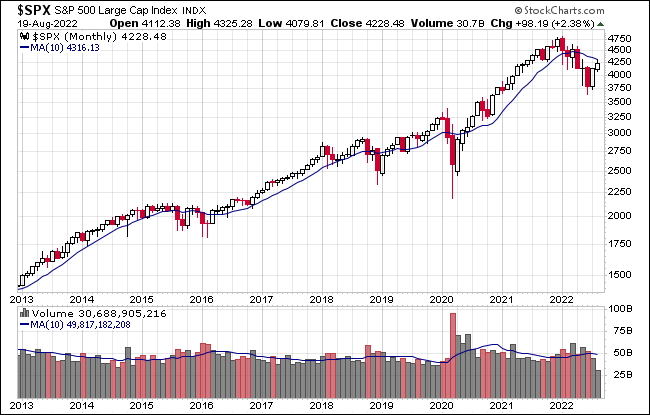
Here's a snapshot of the index going back to 2012.
A Perspective on Drawdowns
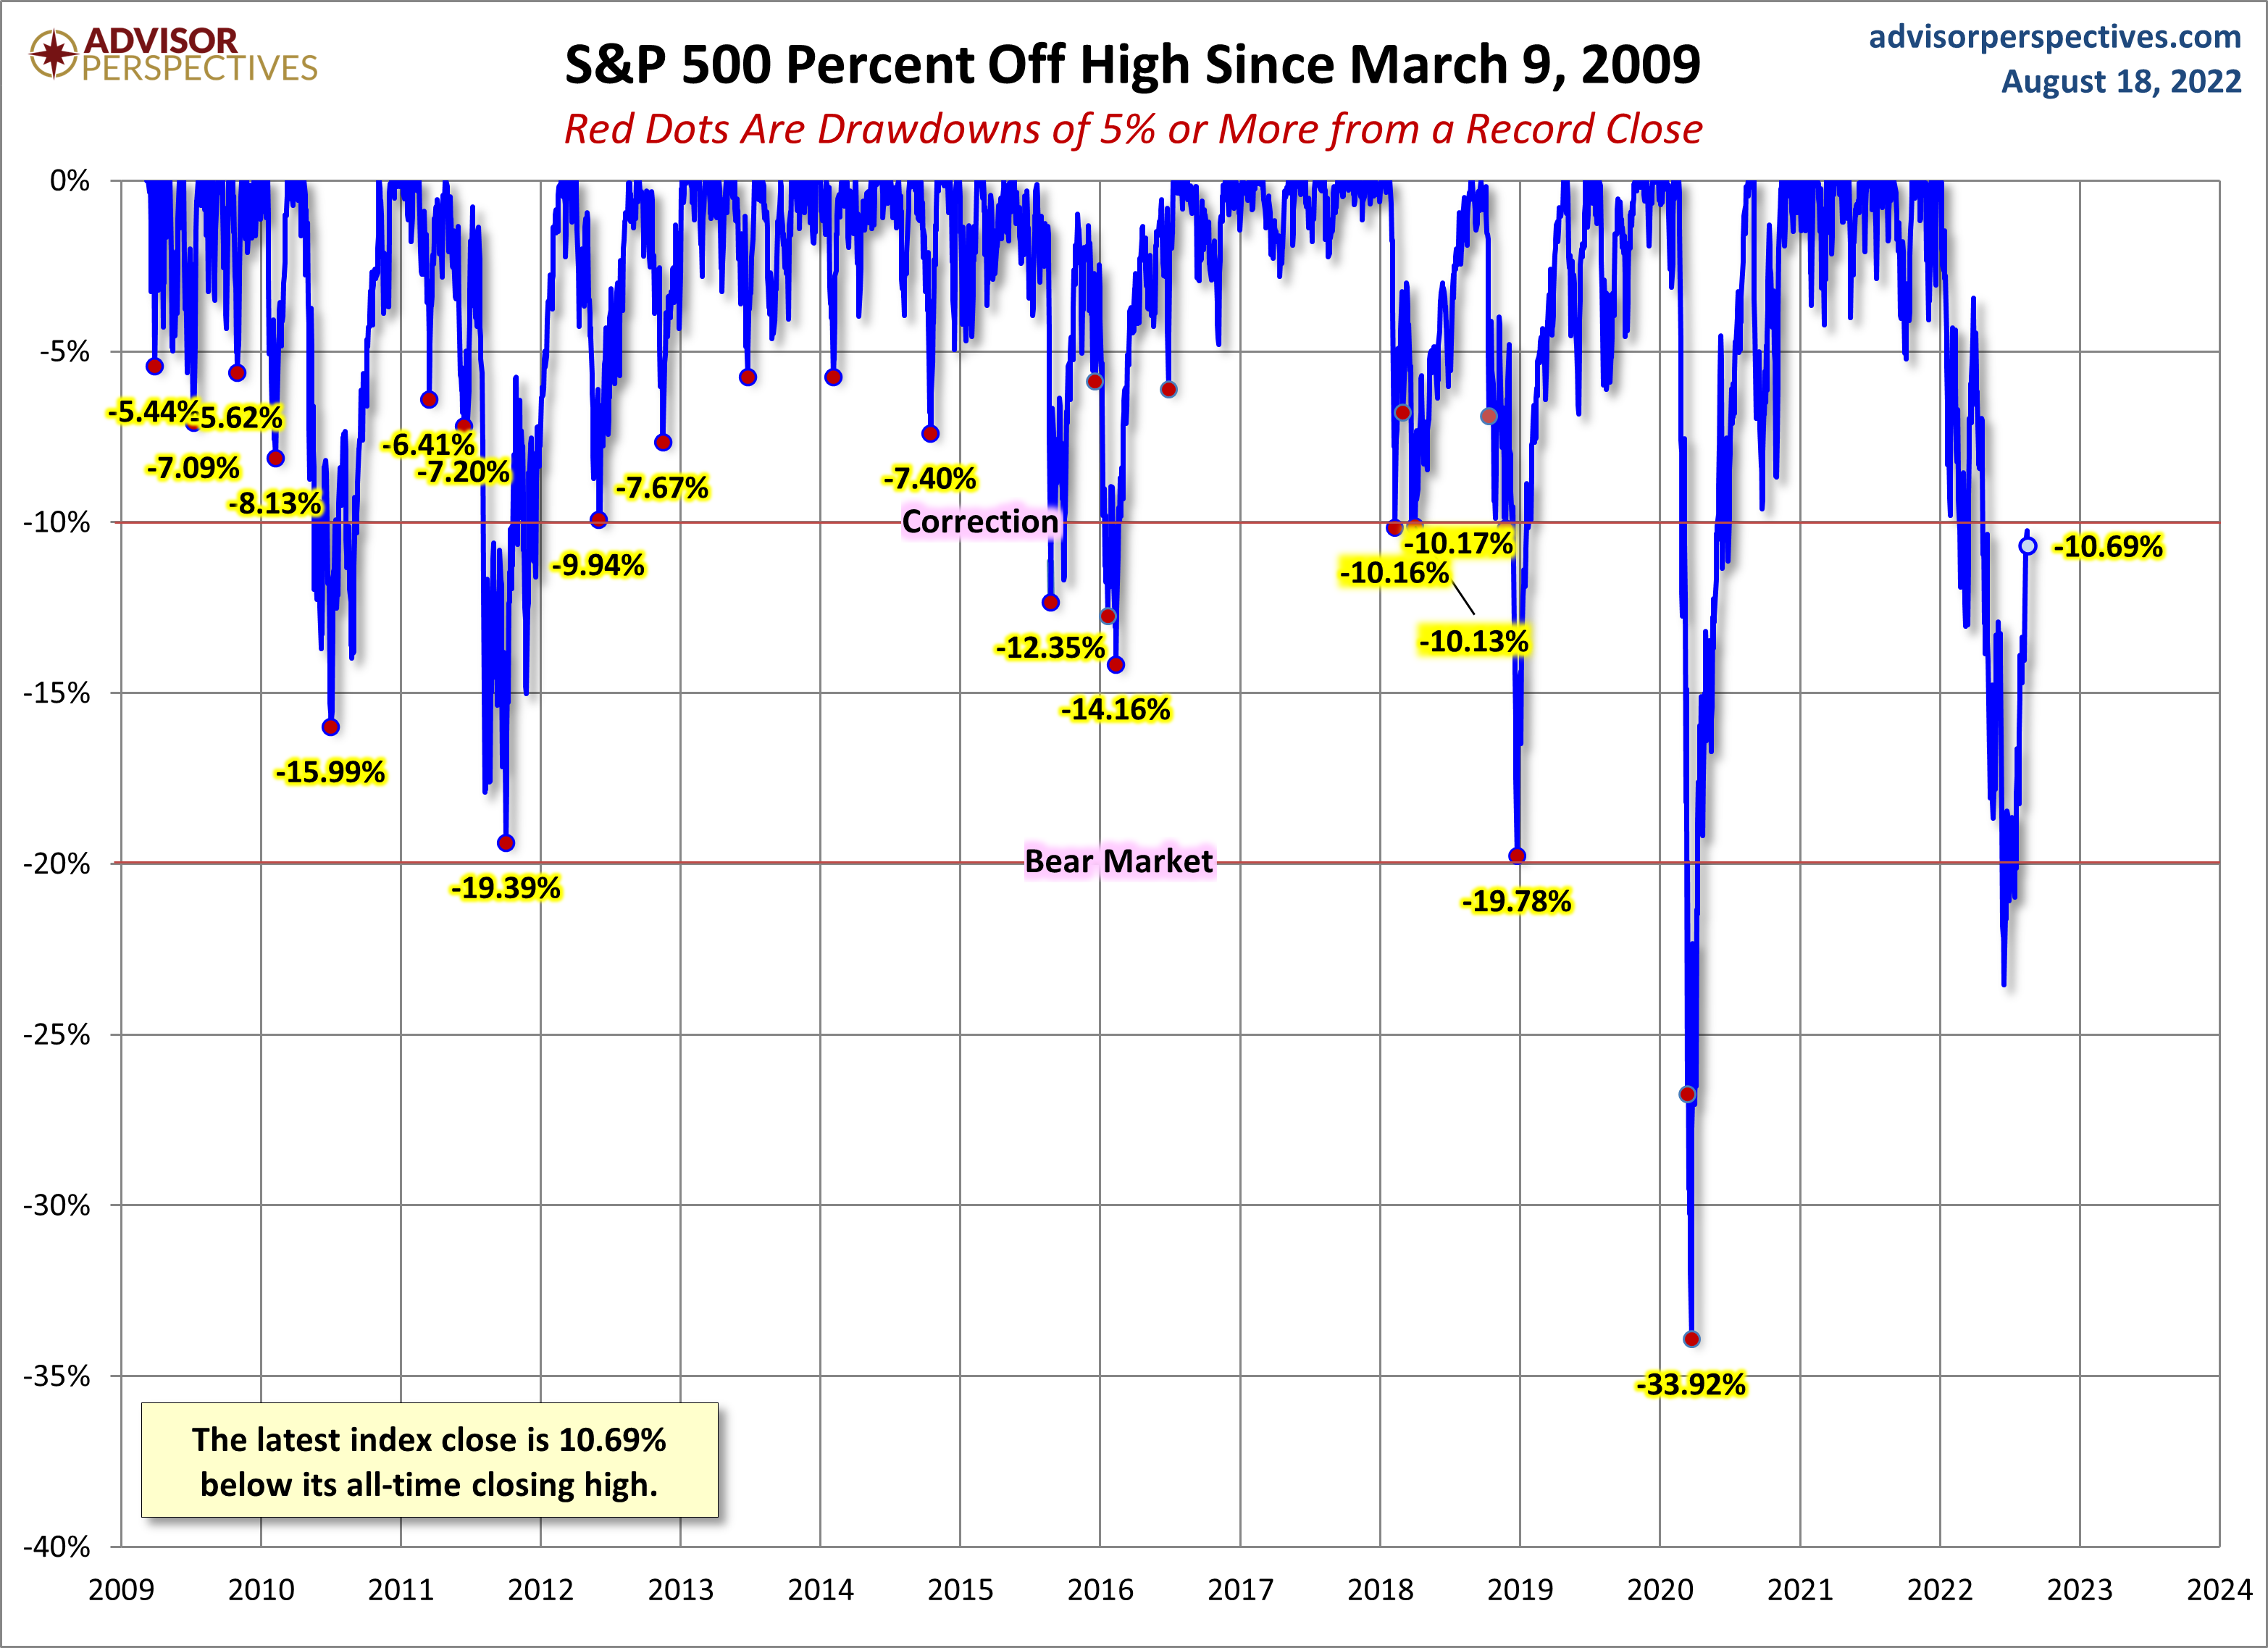
Here's a snapshot of record highs and selloffs since the 2009 trough. Note the recent selloffs in 2022.
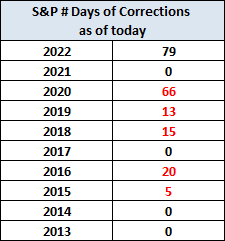
Here's a table with the number of days of a 1% or more change in either direction and the number of days of corrections (down 10% or more from the record high) going back to 2013.

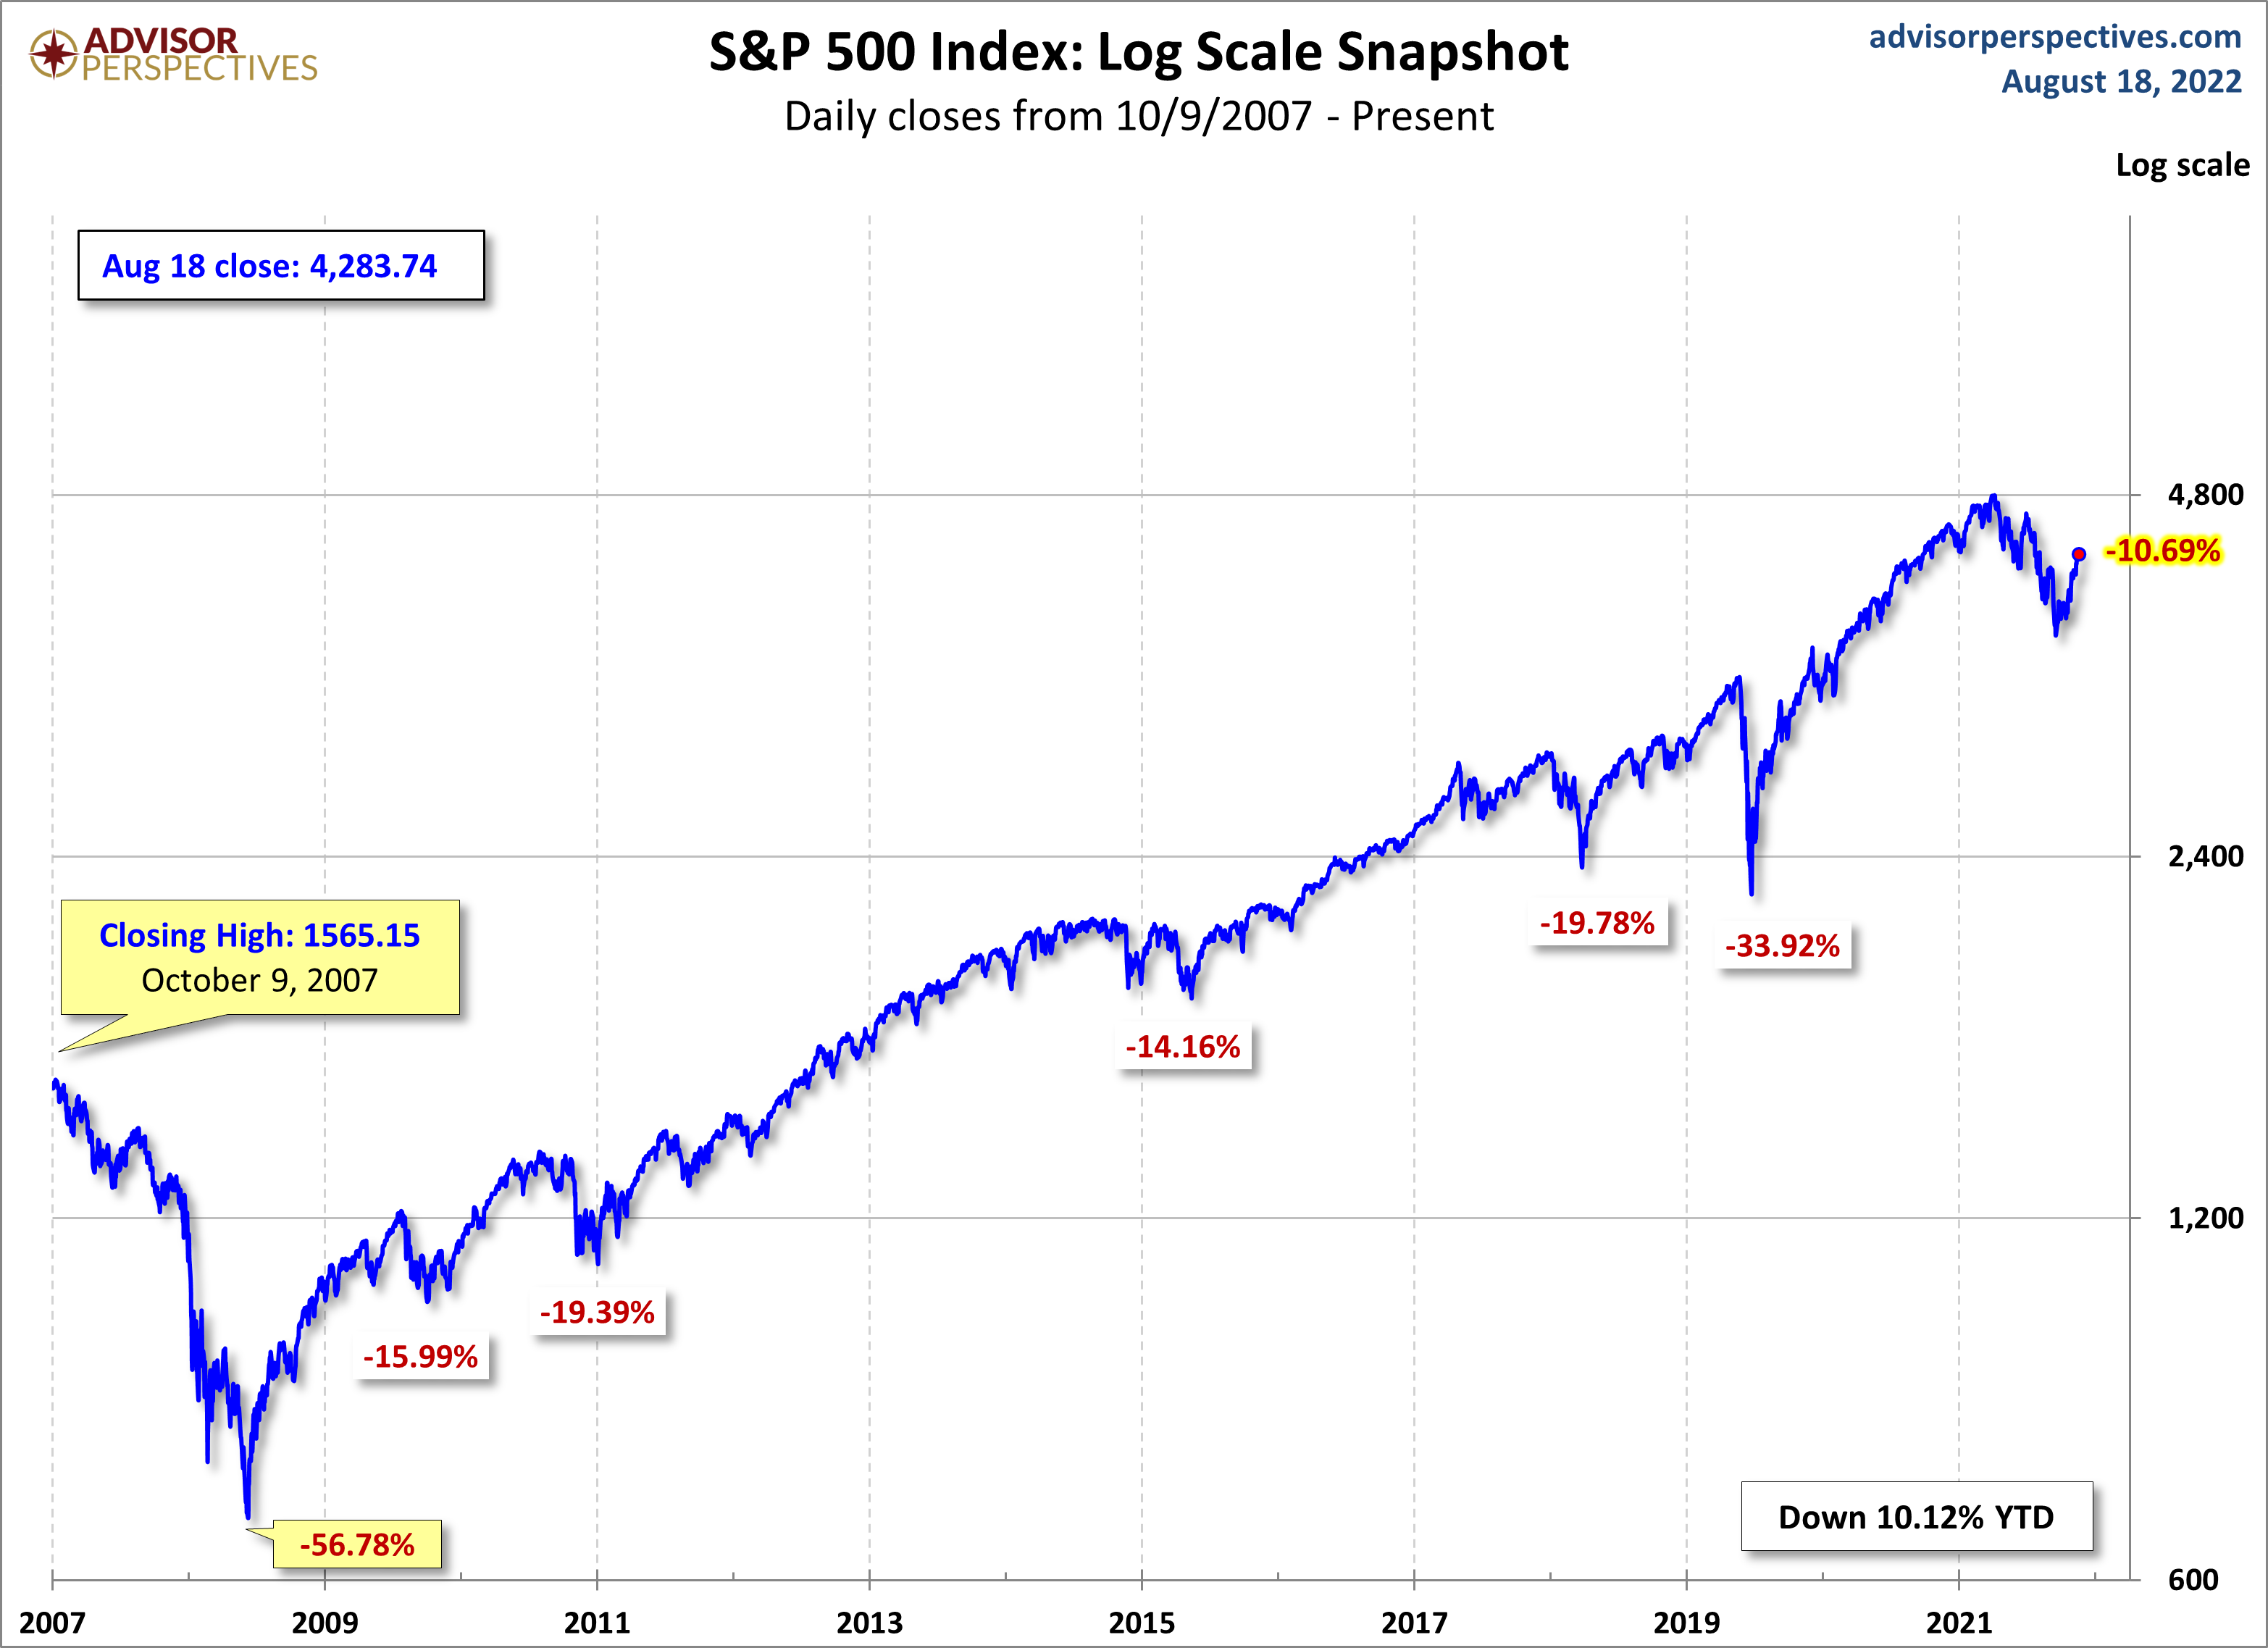
Here is a more conventional log-scale chart with drawdowns highlighted.
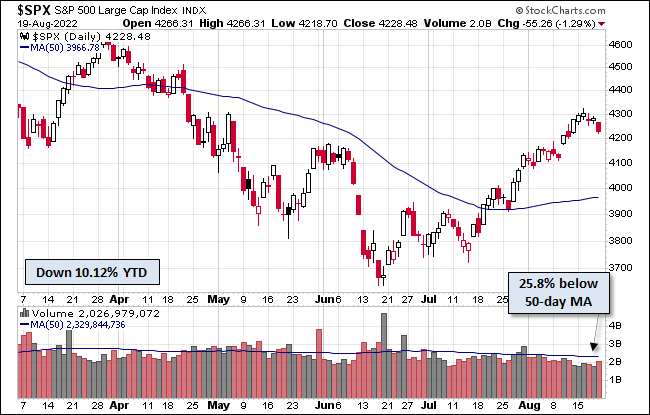
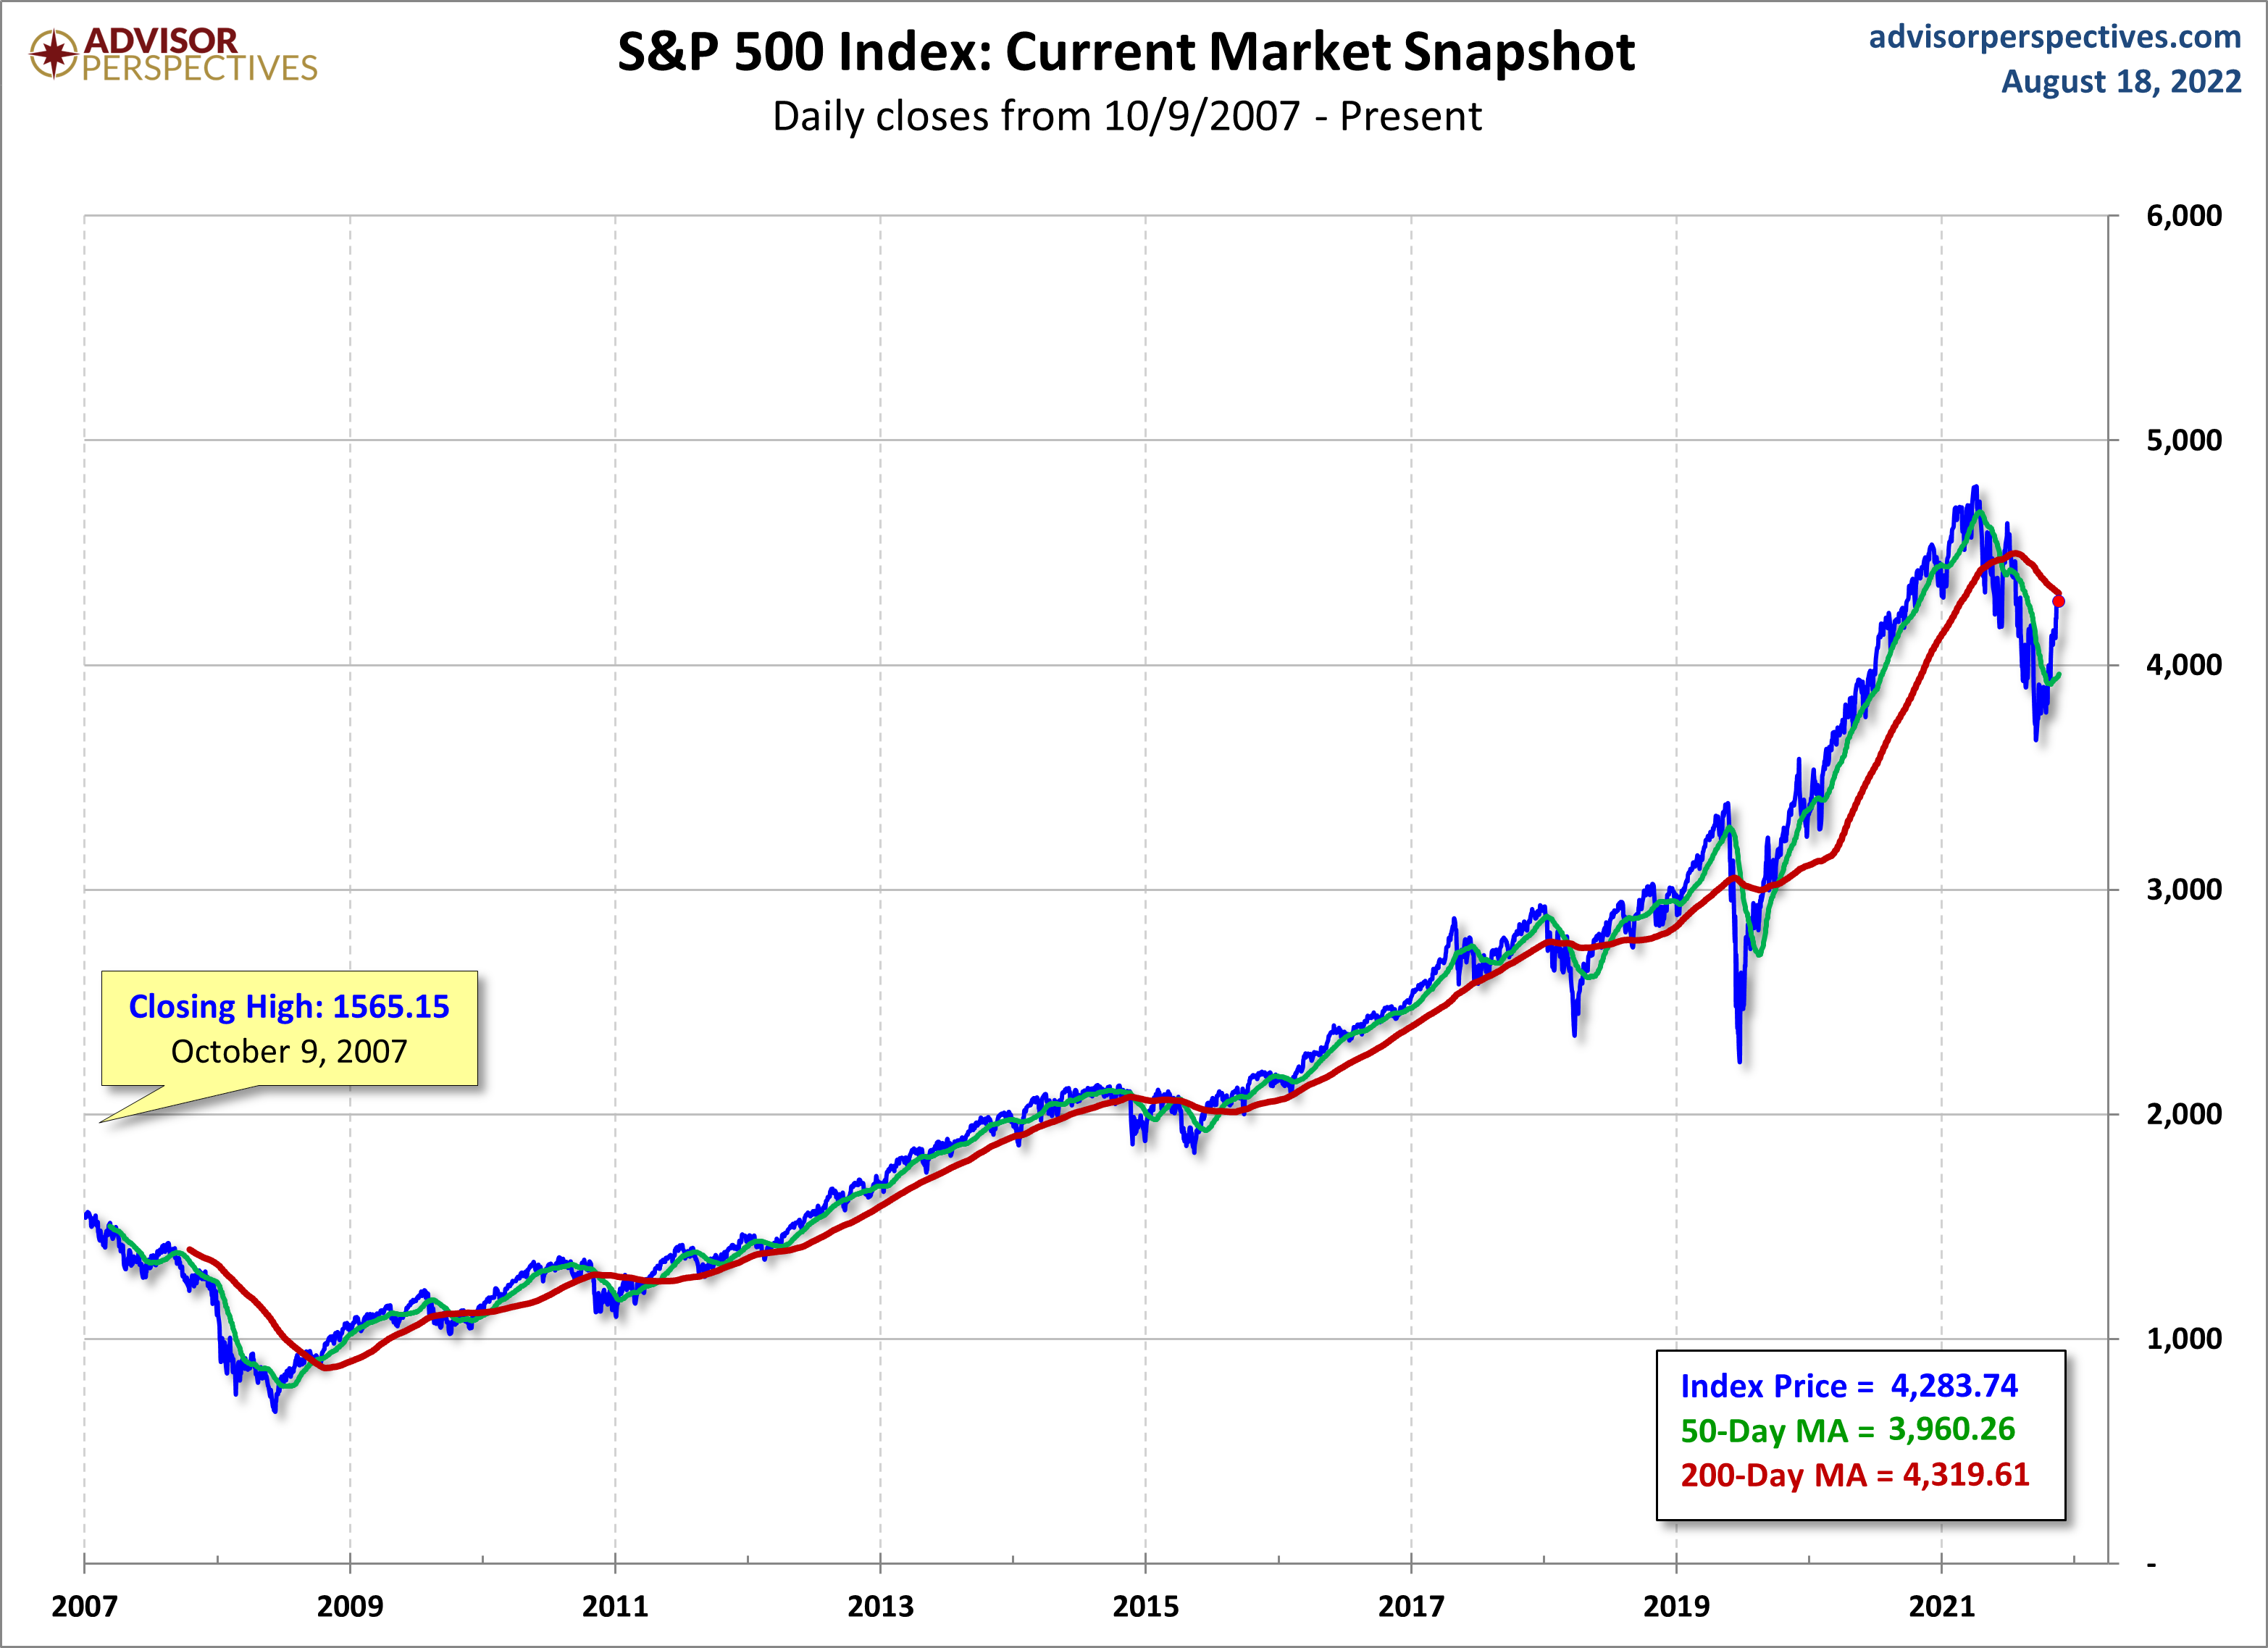
Here is a linear scale version of the same chart with the 50- and 200-day moving averages.
A Perspective on Volatility
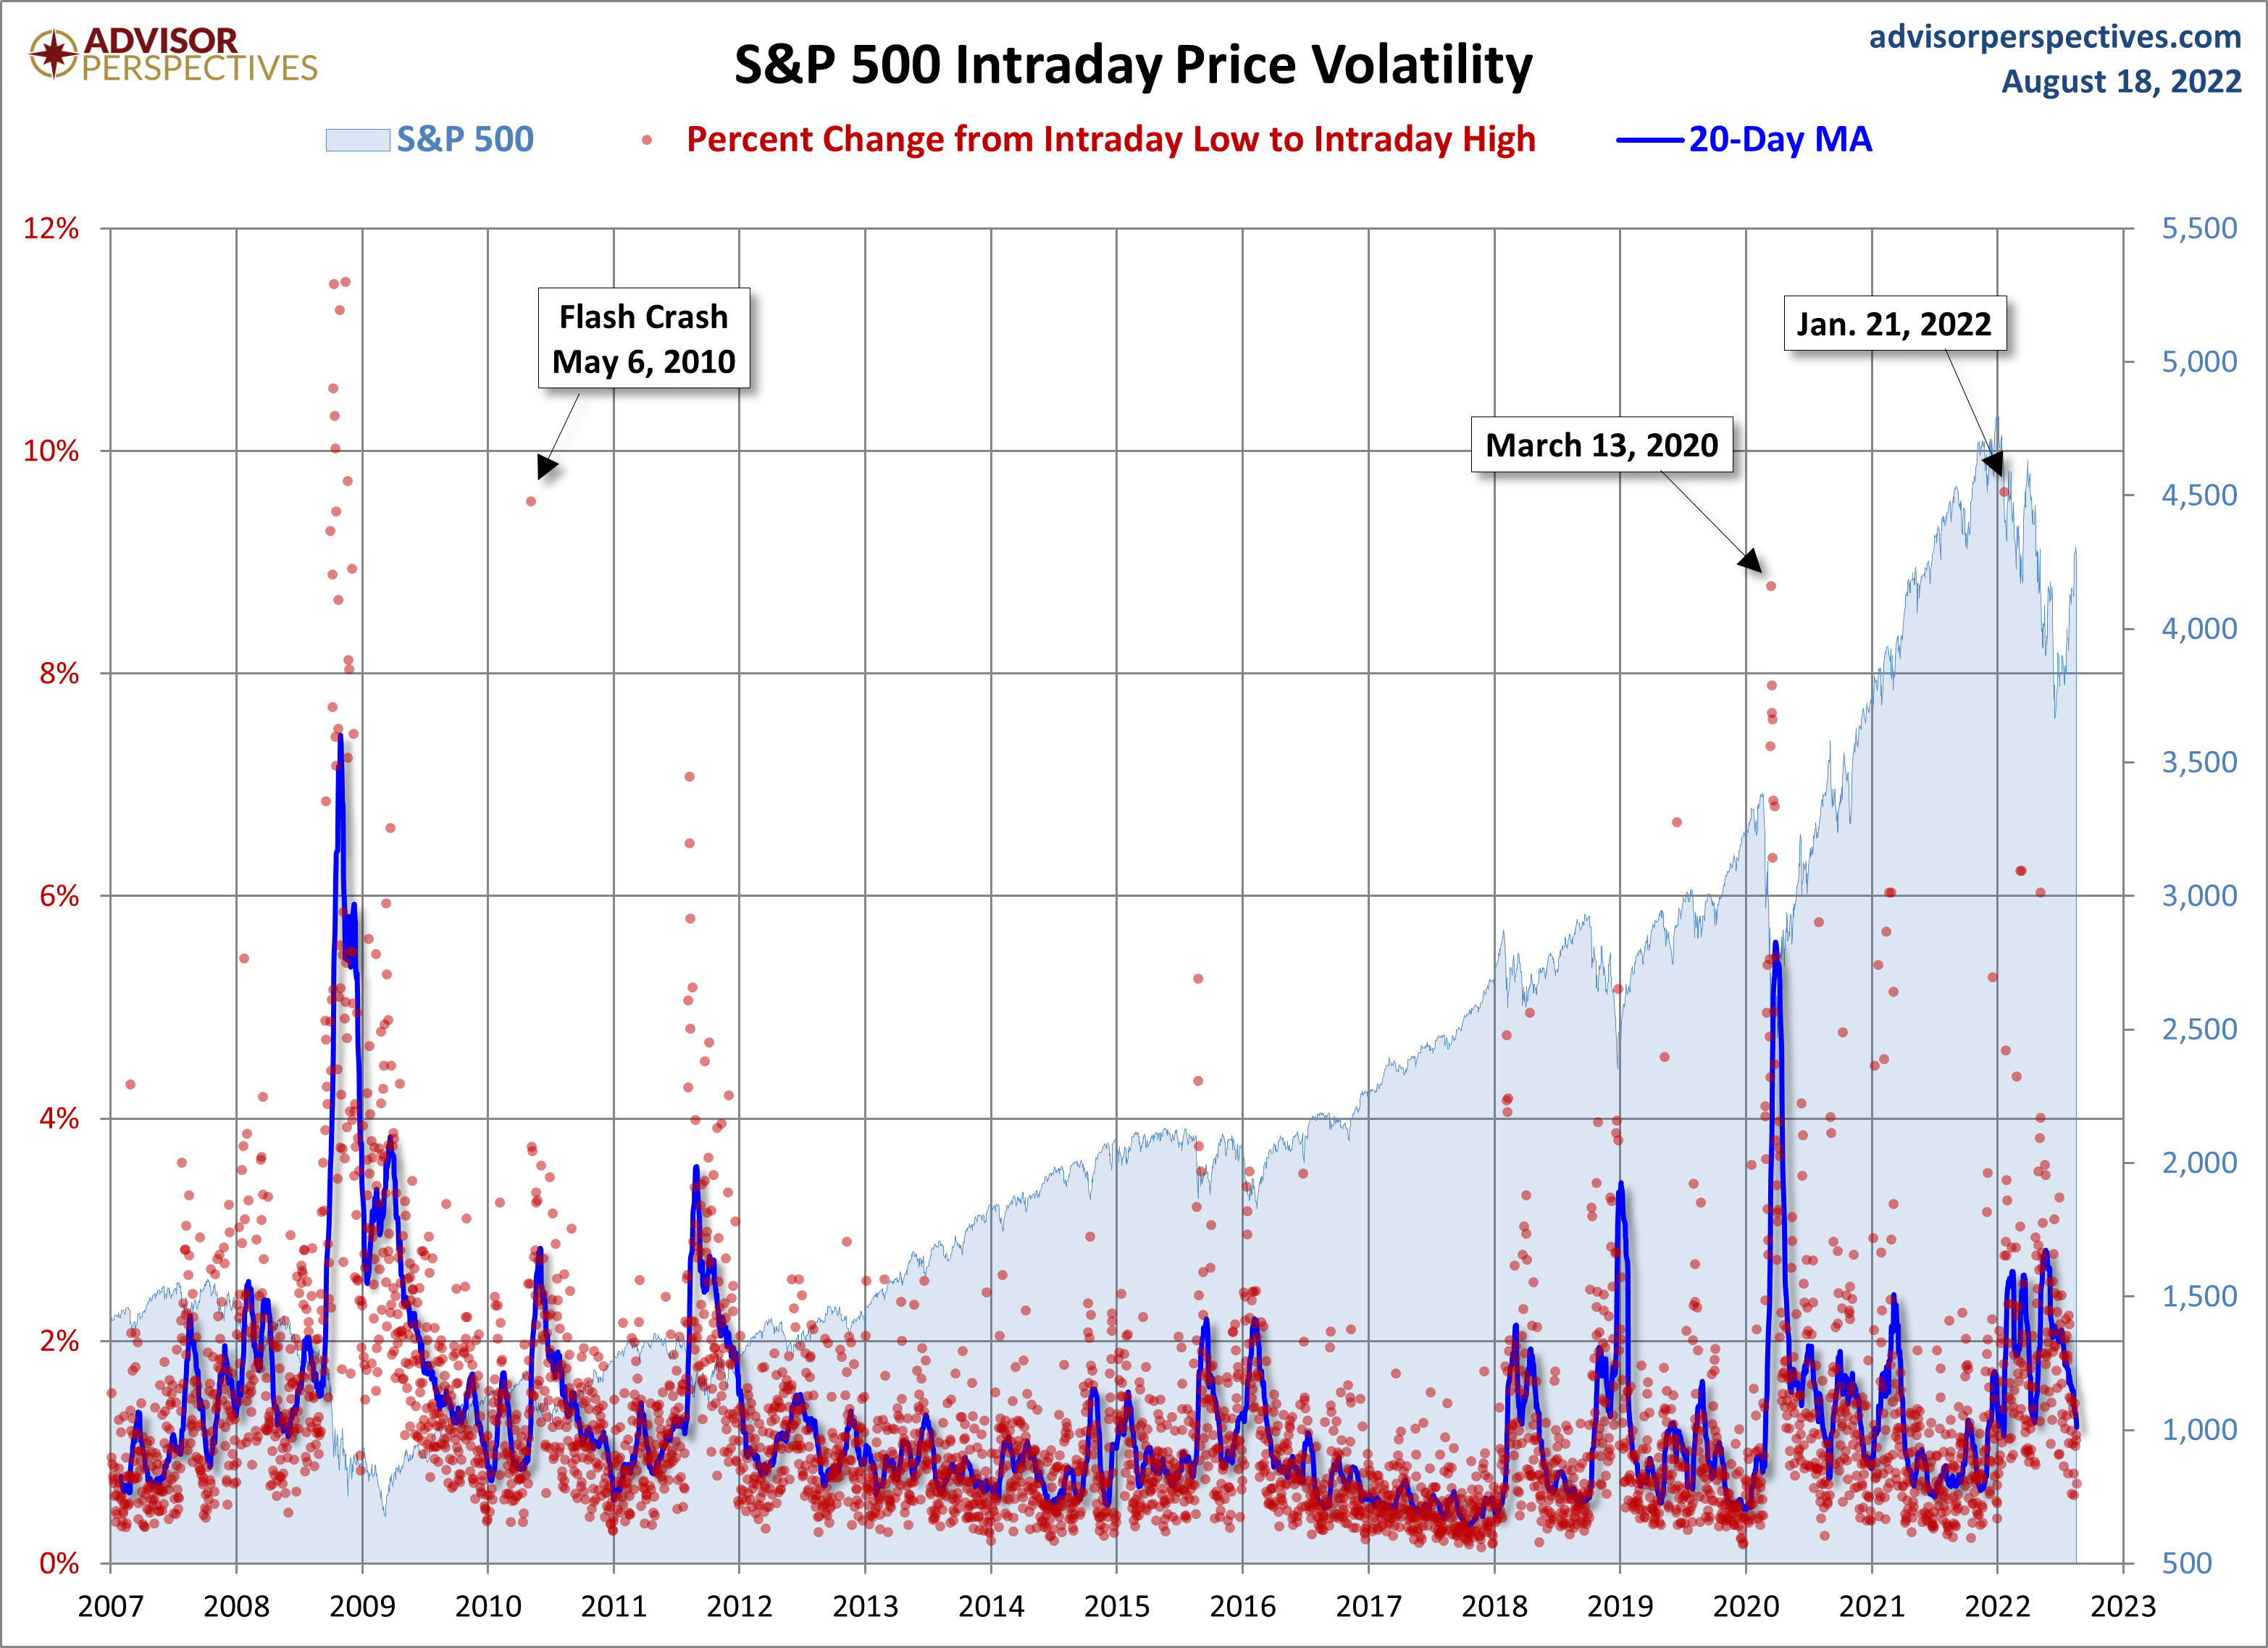
For a sense of the correlation between the closing price and intraday volatility, the chart below overlays the S&P 500 since 2007 with the intraday price range. We've also included a 20-day moving average to help identify trends in volatility.
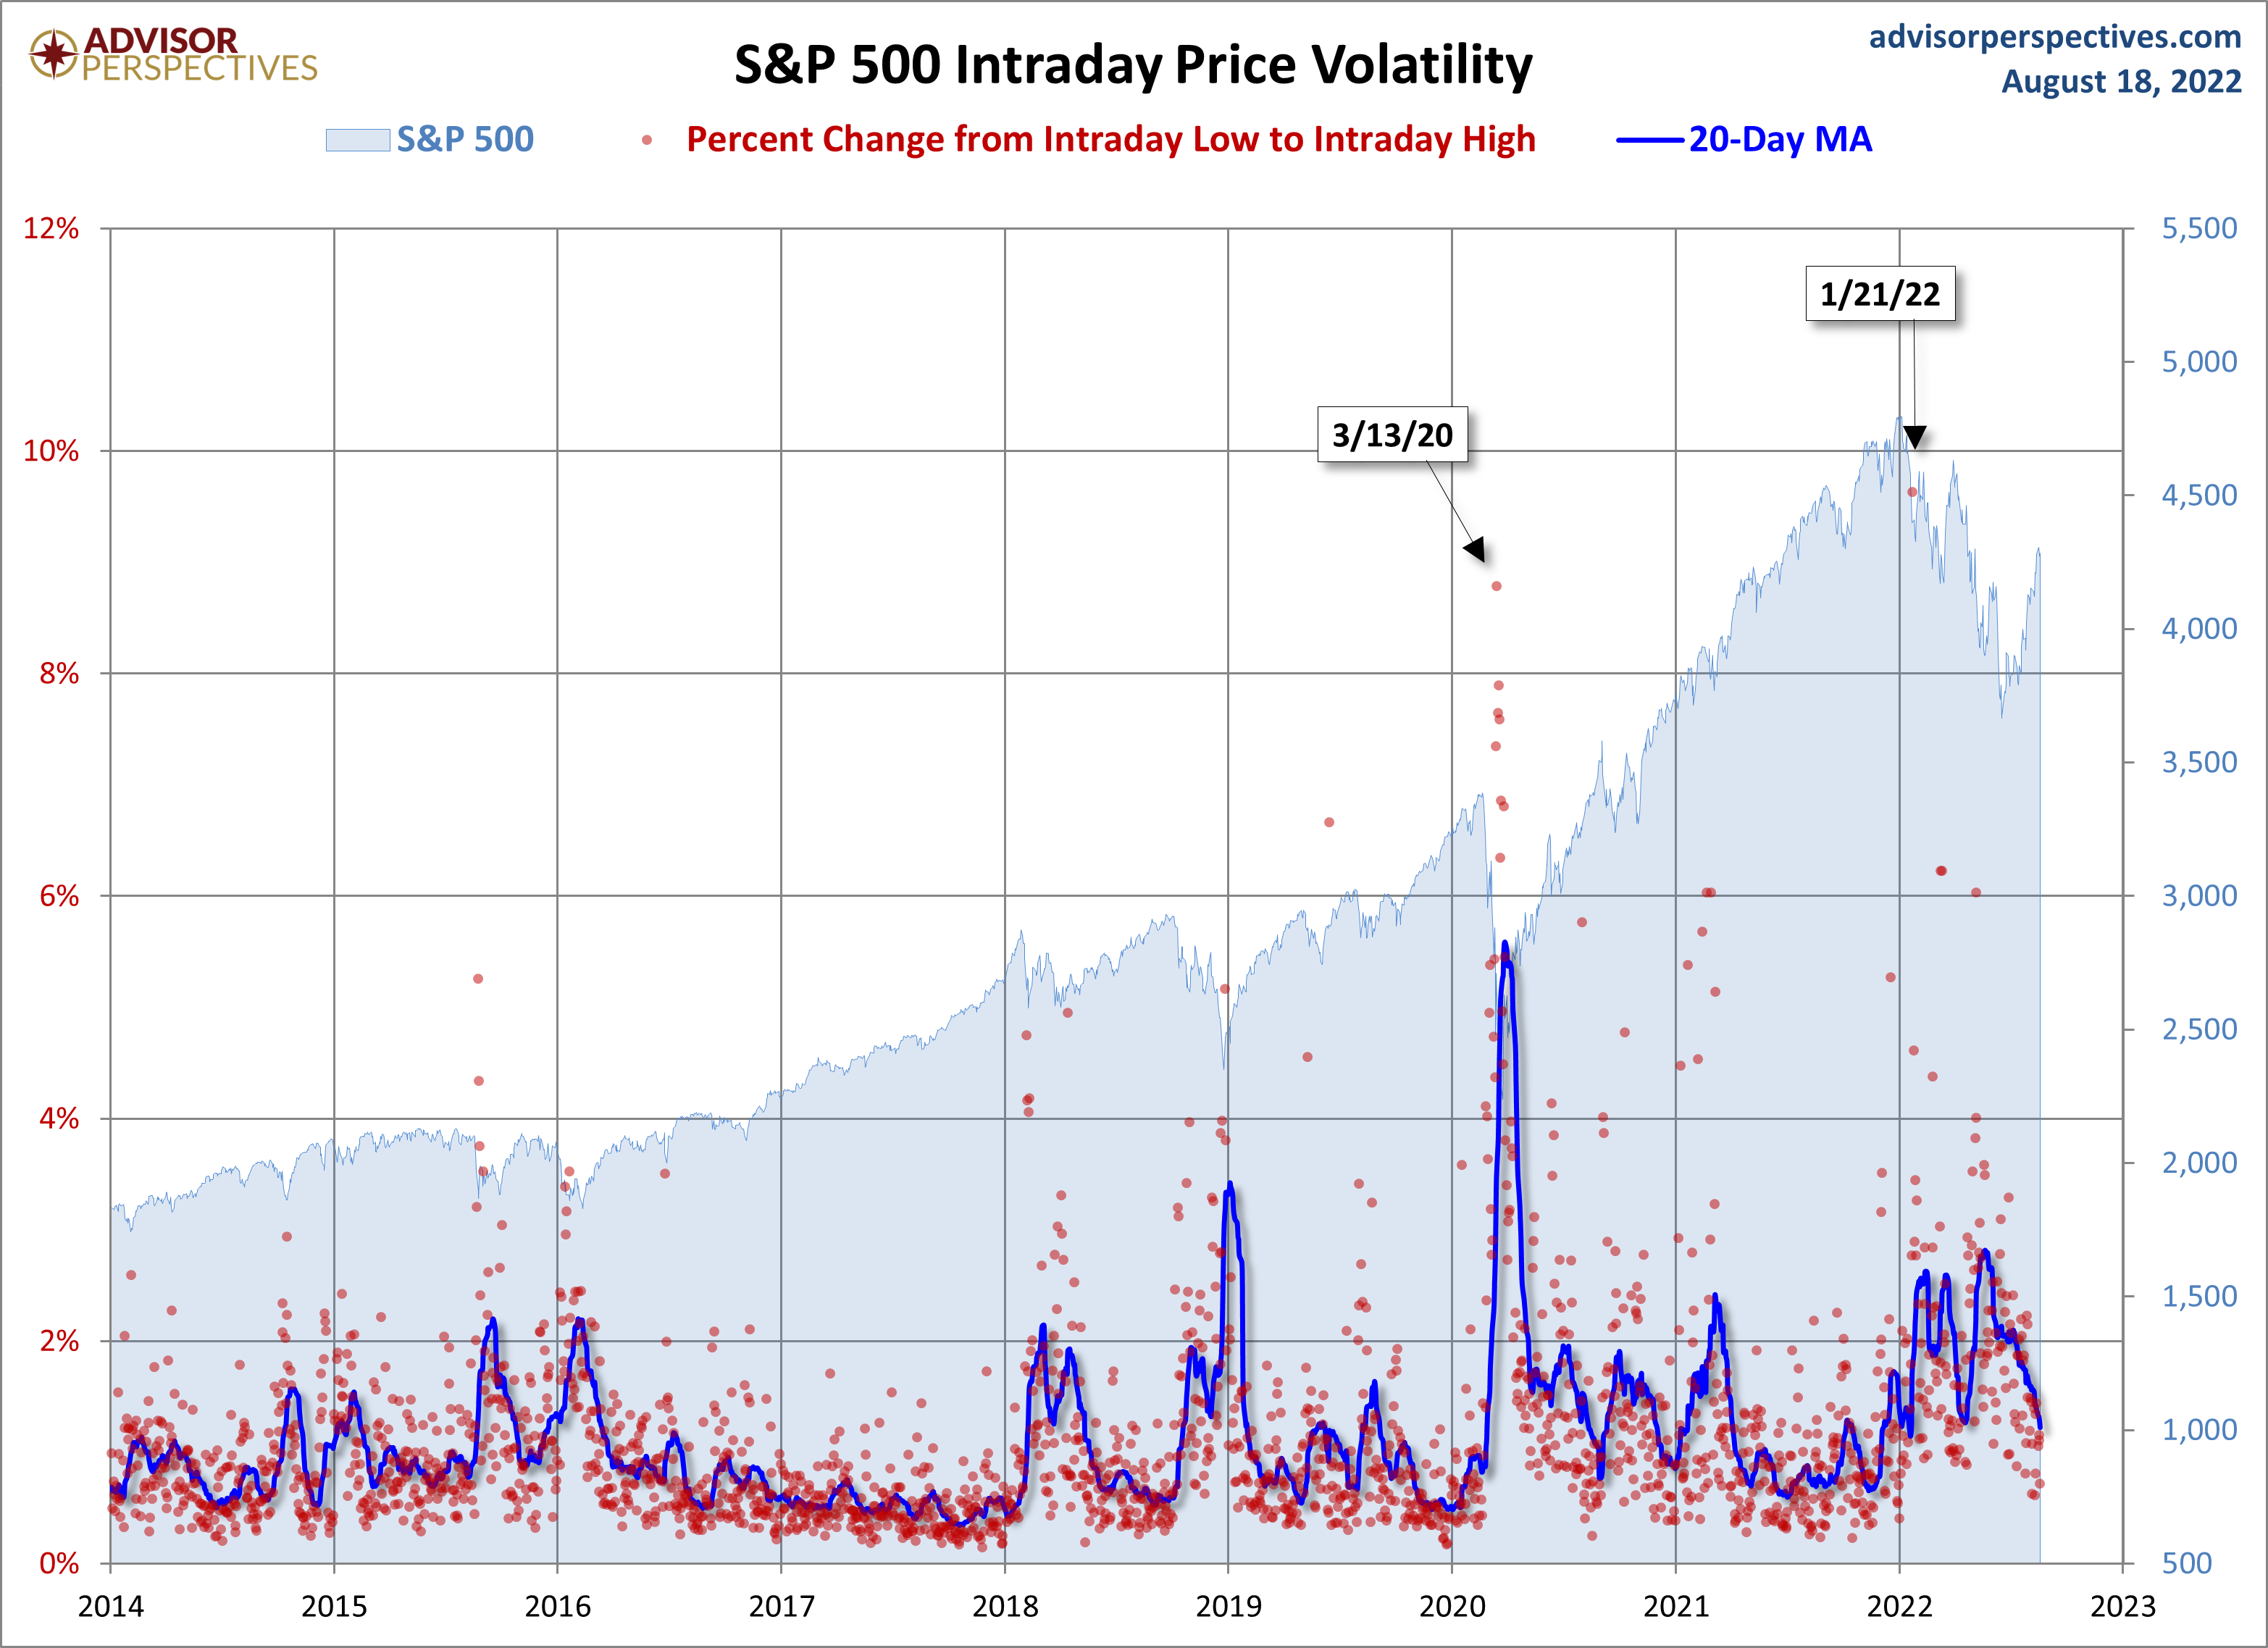
Here's another look, but a slightly more recent look at volatility since 2014.
More By This Author:
Existing-Home Sales: Down 5.9% In JulyMargin Debt: Up 2% In July
ECRI Weekly Leading Index Update - Friday, Aug. 19


Comments
Log in or sign up to join the conversation.