

U.S. stocks nosedived on Wednesday amid cautious sentiment ahead of a high-impact event on Thursday and a lack of clarity on the outcome of the U.S. midterm elections.
Investor angst over the big sell-off in digital assets, which saw bitcoin briefly plummet more than 13% to a two-year low of $16,092 following news that Binance has walked away from a deal to bail out struggling crypto-exchange FTX, also seemed to weigh on the mood. Against this backdrop, the S&P 500 slumped 2.08% to 3,748, ending a three-day winning streak, with the energy and consumer discretionary sectors leading the rout in a sea of red.
Focusing on politics, Americans headed to the polls yesterday to pick their congressional leaders. Republicans were expected to sweep key races, but the red wave did not materialize, though they are still favored to gain a thin majority in the House of Representatives, a situation that could paralyze Biden’s legislative agenda. The "gridlock scenario" may provide cover for the Federal Reserve to be less hawkish over the medium term and thus support equities, but this thesis will take time to play out.
In the shorter term, incoming macro data will likely be more important for risk assets. That said, traders should keep a close eye on one important release on Thursday: the October U.S. inflation report, which will offer key information on the trend in consumer prices and guide expectations for the FOMC monetary policy outlook.
In terms of estimates, annual CPI (headline) is seen clocking in at 8.0% from 8.2%, while the core gauge is forecast to ease to 6.5% from 6.6%, a small directional improvement in both cases. With energy prices starting to moderate at a slower pace, food drifting higher and shelter costs biased upward, tomorrow's data could handily top projections, reinforcing the bearish tone on Wall Street. This could create a hostile environment for the S&P 500.
The opposite case is also worth analyzing. If CPI numbers surprise to the downside and point to a meaningful deceleration in price growth, a large relief-rally could unfold, amplified by thin liquidity conditions and light positioning. In this scenario, bond yields and the U.S. dollar are likely to head lower as extreme Fed hawkishness gets priced out.
S&P 500 TECHNICAL ANALYSIS
After failing to clear trendline resistance in the 3,860 area, the S&P 500 has resumed its decline, with the index now heading towards technical support located in the 3,700-3,710 zone. If prices break below this floor in the coming days, sellers could launch an attack on 3,640, followed by 3,580.
On the other hand, if dip buyers resurface and spark a bullish reversal, initial resistance appears at 3,810/3,860. If this barrier is taken out decisively, the focus shifts to November’s high near 3,610.
S&P 500 TECHNICAL CHART
(Click on image to enlarge)
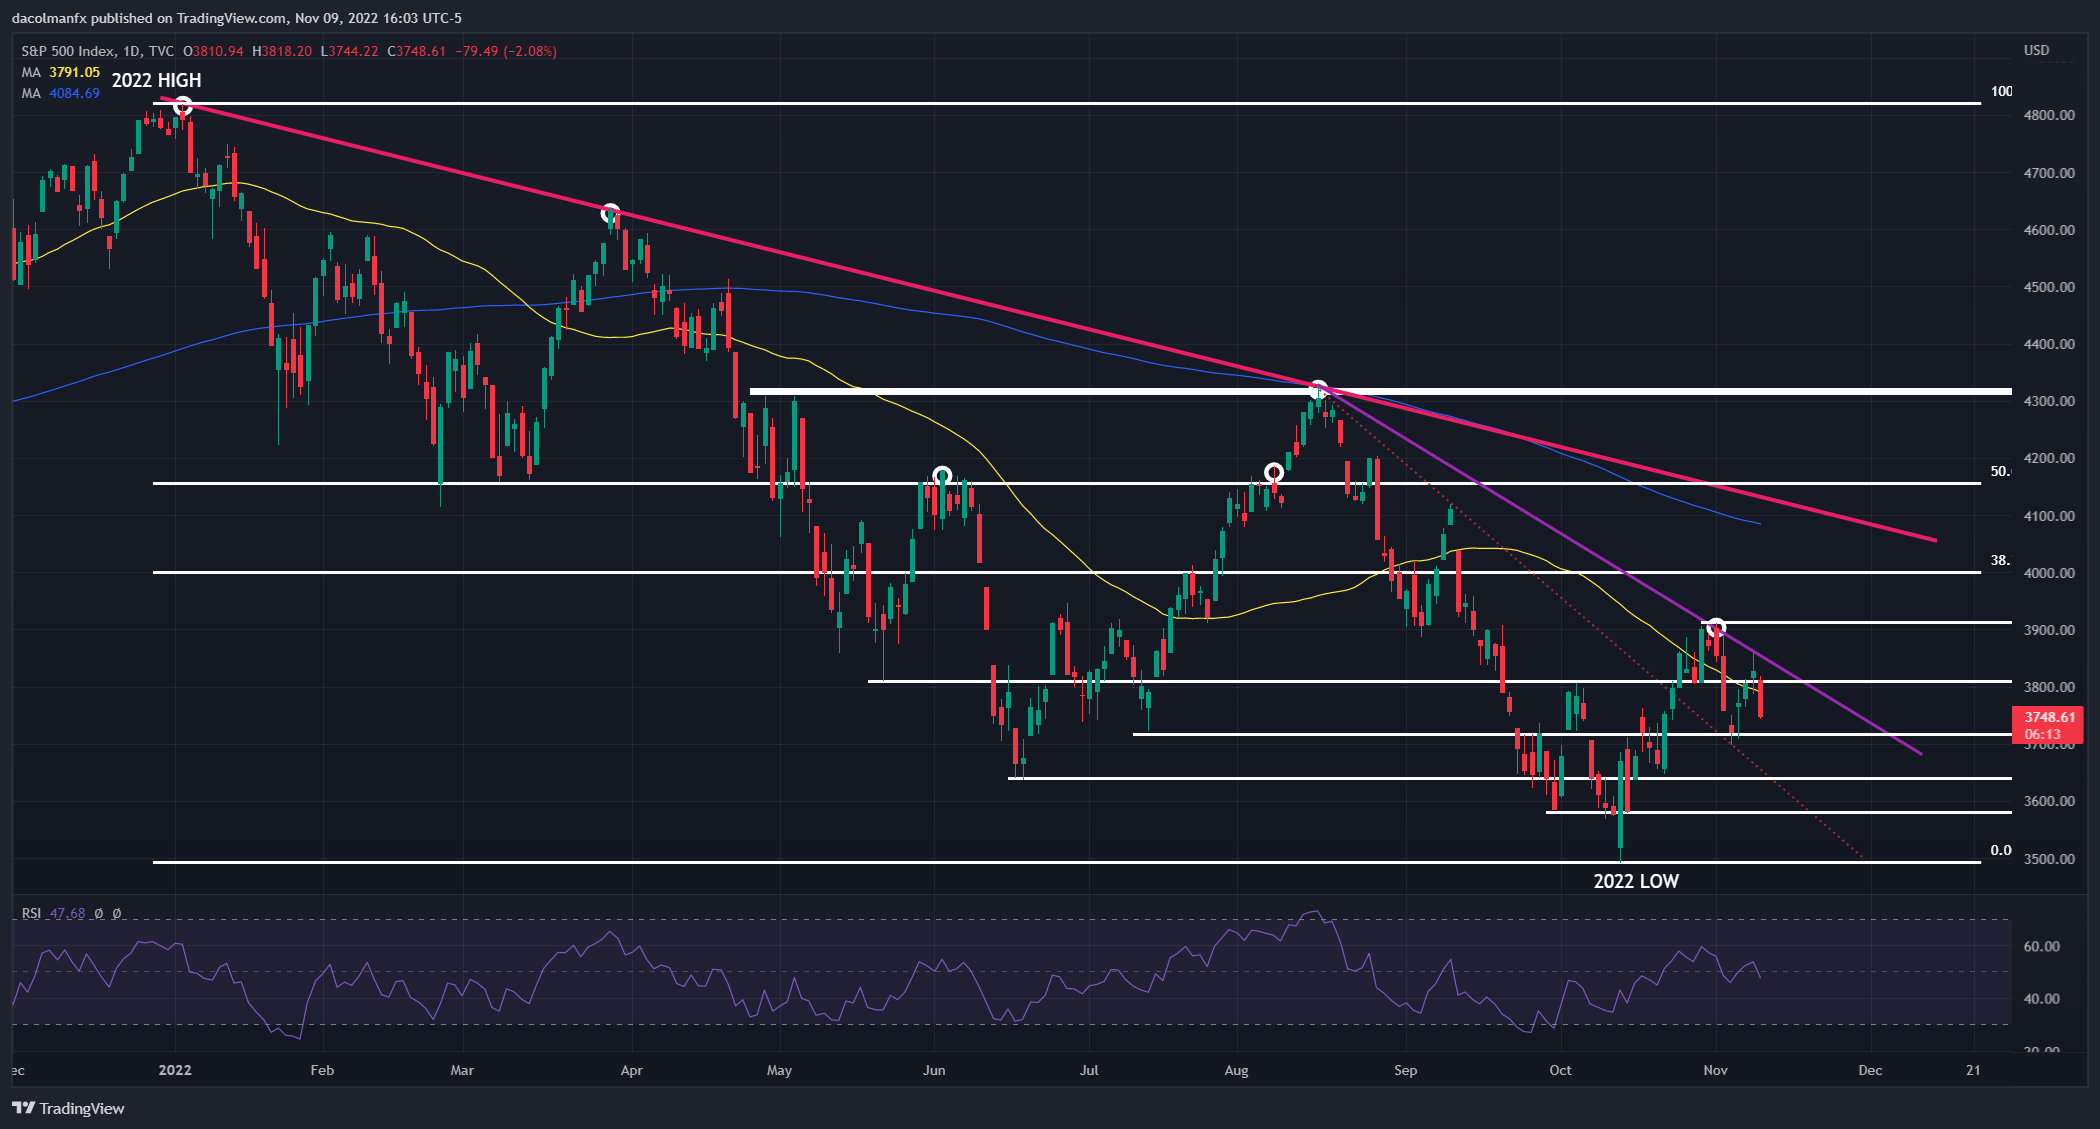
S&P 500 Chart Prepared Using TradingView
More By This Author:
Euro’s Fate Hinges On US Inflation Data, Major Tech Levels To Watch On EUR/USD
S&P 500 Rises for Third Straight Day Ahead Of Midterm Election Results, CPI Data Next
British Pound Gains But Outlook Still Bleak, GBP/USD Eyes US Inflation For Cues


Comments
Log in or sign up to join the conversation.