
S&P 500 Price Forecast: SPX Begins Pullback From Resistance
US equities staged a recovery in the final full week of May after a threatening theme enveloped stocks in the first four months of the 2022 trade.
In the S&P 500, the index put in a really strong showing last week to wipe away the losses from earlier in the month. The net result – a doji on the monthly chart of the S&P 500 and this isn’t a very common occurrence. This, of course, highlights indecision; but to anyone watching in the first few months of the year, they’d likely remember that there’s been little of that as sellers have controlled the matter for much of the year already. This indecision is more indicative of sellers stepping back from the ledge but, this wouldn’t be the first time that we’ve seen that in 2022 trade.
This is very similar to what showed in March of this year, just after the Fed started hiking rates. Going into that rate decision, there was fear around QT and how quickly the Fed might look to pare their bond holdings. But – when they avoided the topic altogether stocks flew higher as shorts were squeezed, and that rally lasted into the end of the month and the end of Q1. But, as the door opened into Q2 sellers made a reappearance, and for the most part, remained in control of price action for the next six weeks.
At this stage, the S&P 500 is finding resistance around prior support, taken from the zone that was helping to hold the lows back in mid-March, around the time of that FOMC-fueled reversal. This resistance is in a confluent zone between a couple of Fibonacci levels, plotted at 4186 and 4211.
On the support side of the matter, there’s another confluent zone at play, running between 3802 and 3830.
S&P 500 Weekly Price Chart
(Click on image to enlarge)
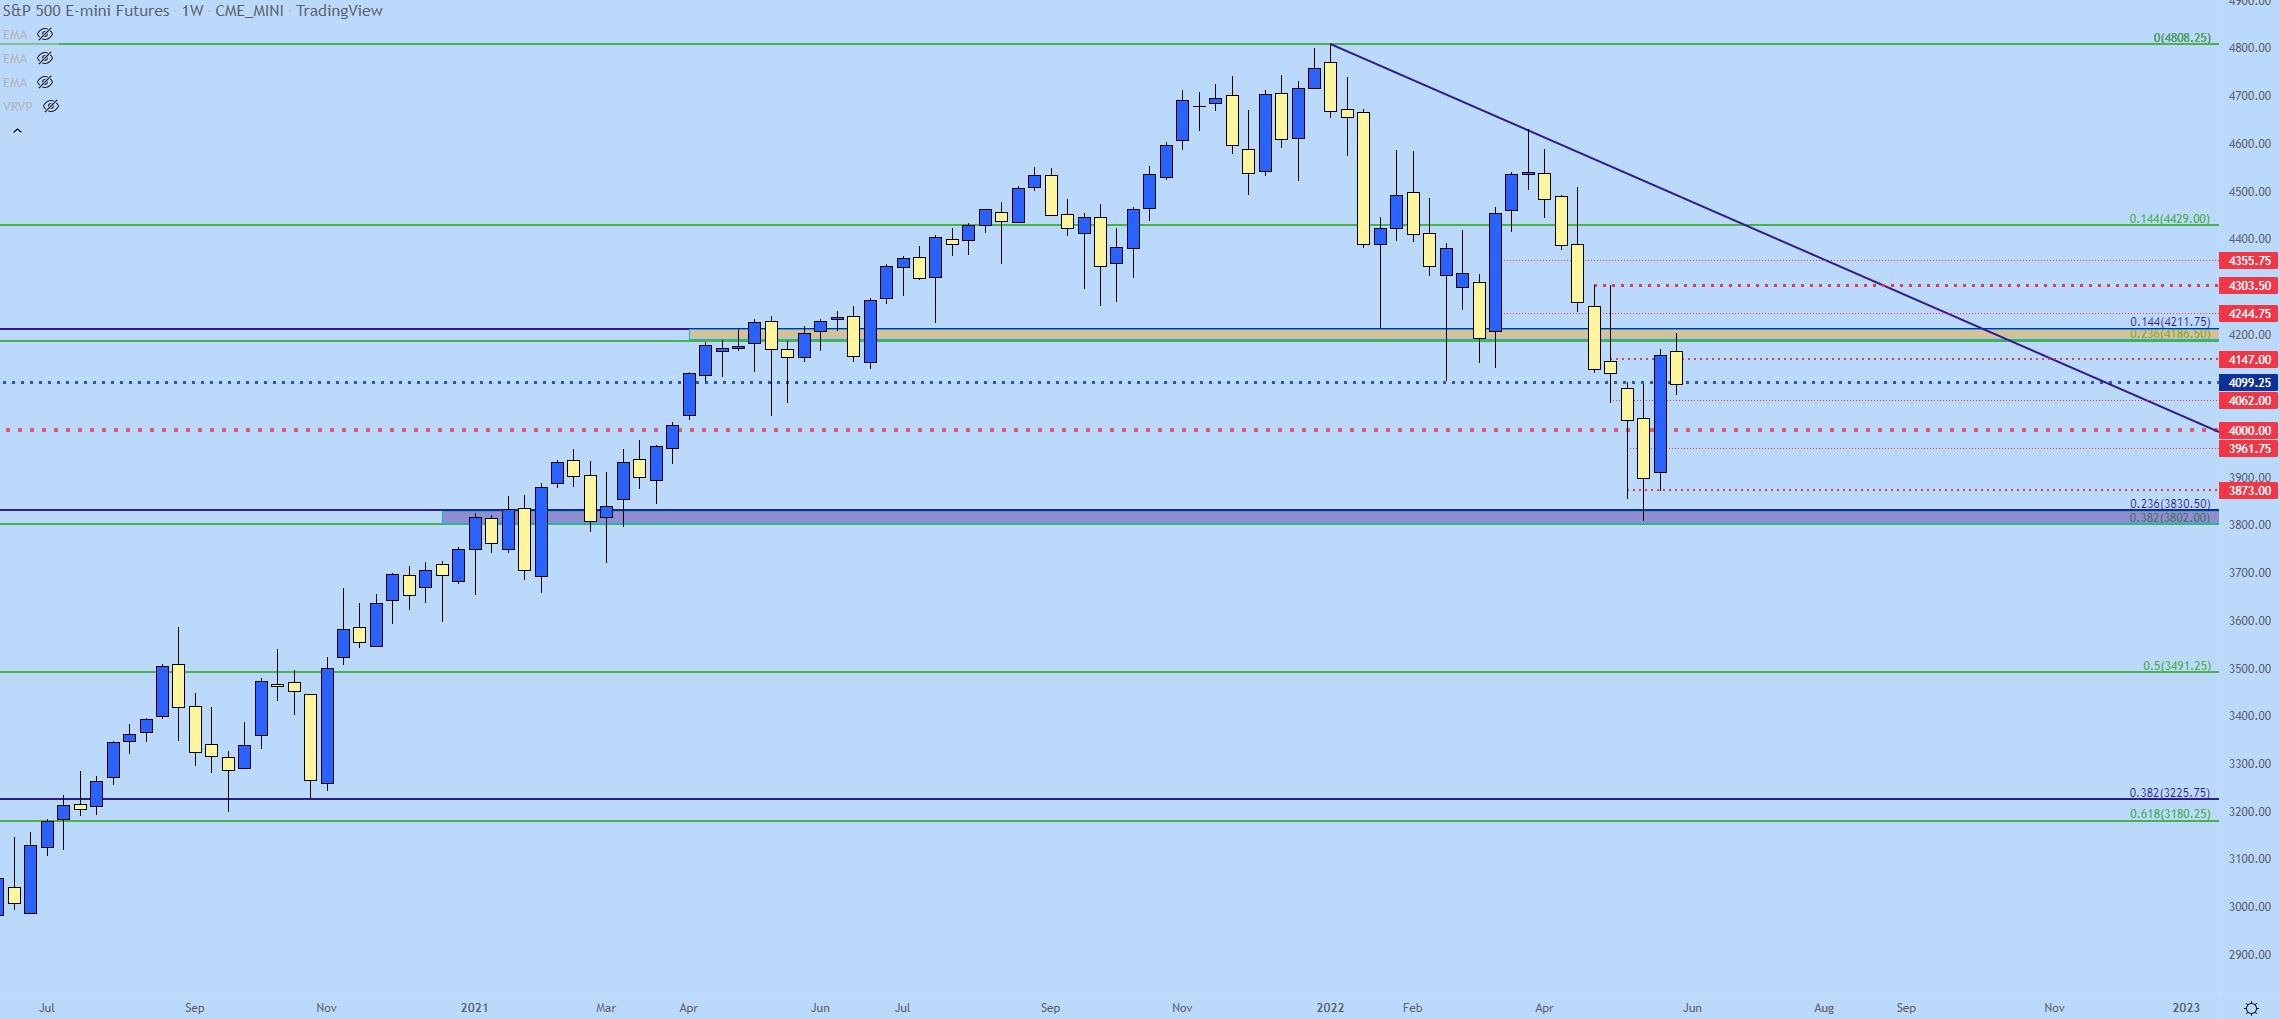
Chart prepared by James Stanley; S&P 500 on Tradingview
Taking a step back the monthly chart highlights the importance of the above support and resistance zones. The spot of support is confluent between the 38.2% retracement of the pandemic move and the 23.6% retracement of the post-financial Collapse move. Resistance is taken from the 23.6% mark of the pandemic move along with the 14.4% retracement of the post-financial Collapse move.
This highlights how the pullback, so far, is but a small portion of the recent run in equities. And what makes this of interest is the fact for the first time during this run in the post-GFC environment, the Fed is faced with no choice but to hike rates in the effort of stemming inflation.
Yesterday heard a mea culpa from Treasury Secretary Janet Yellen regarding her previous take on inflation. And then Jamie Dimon, a man not known for hyperbole, warned of a ‘hurricane’ on the horizon. Both comments are rooted in the same source, fear that the Fed will have little choice when it comes to a policy as the bank simply has to address inflation as directly as they can.
S&P 500 Monthly Price Chart
(Click on image to enlarge)
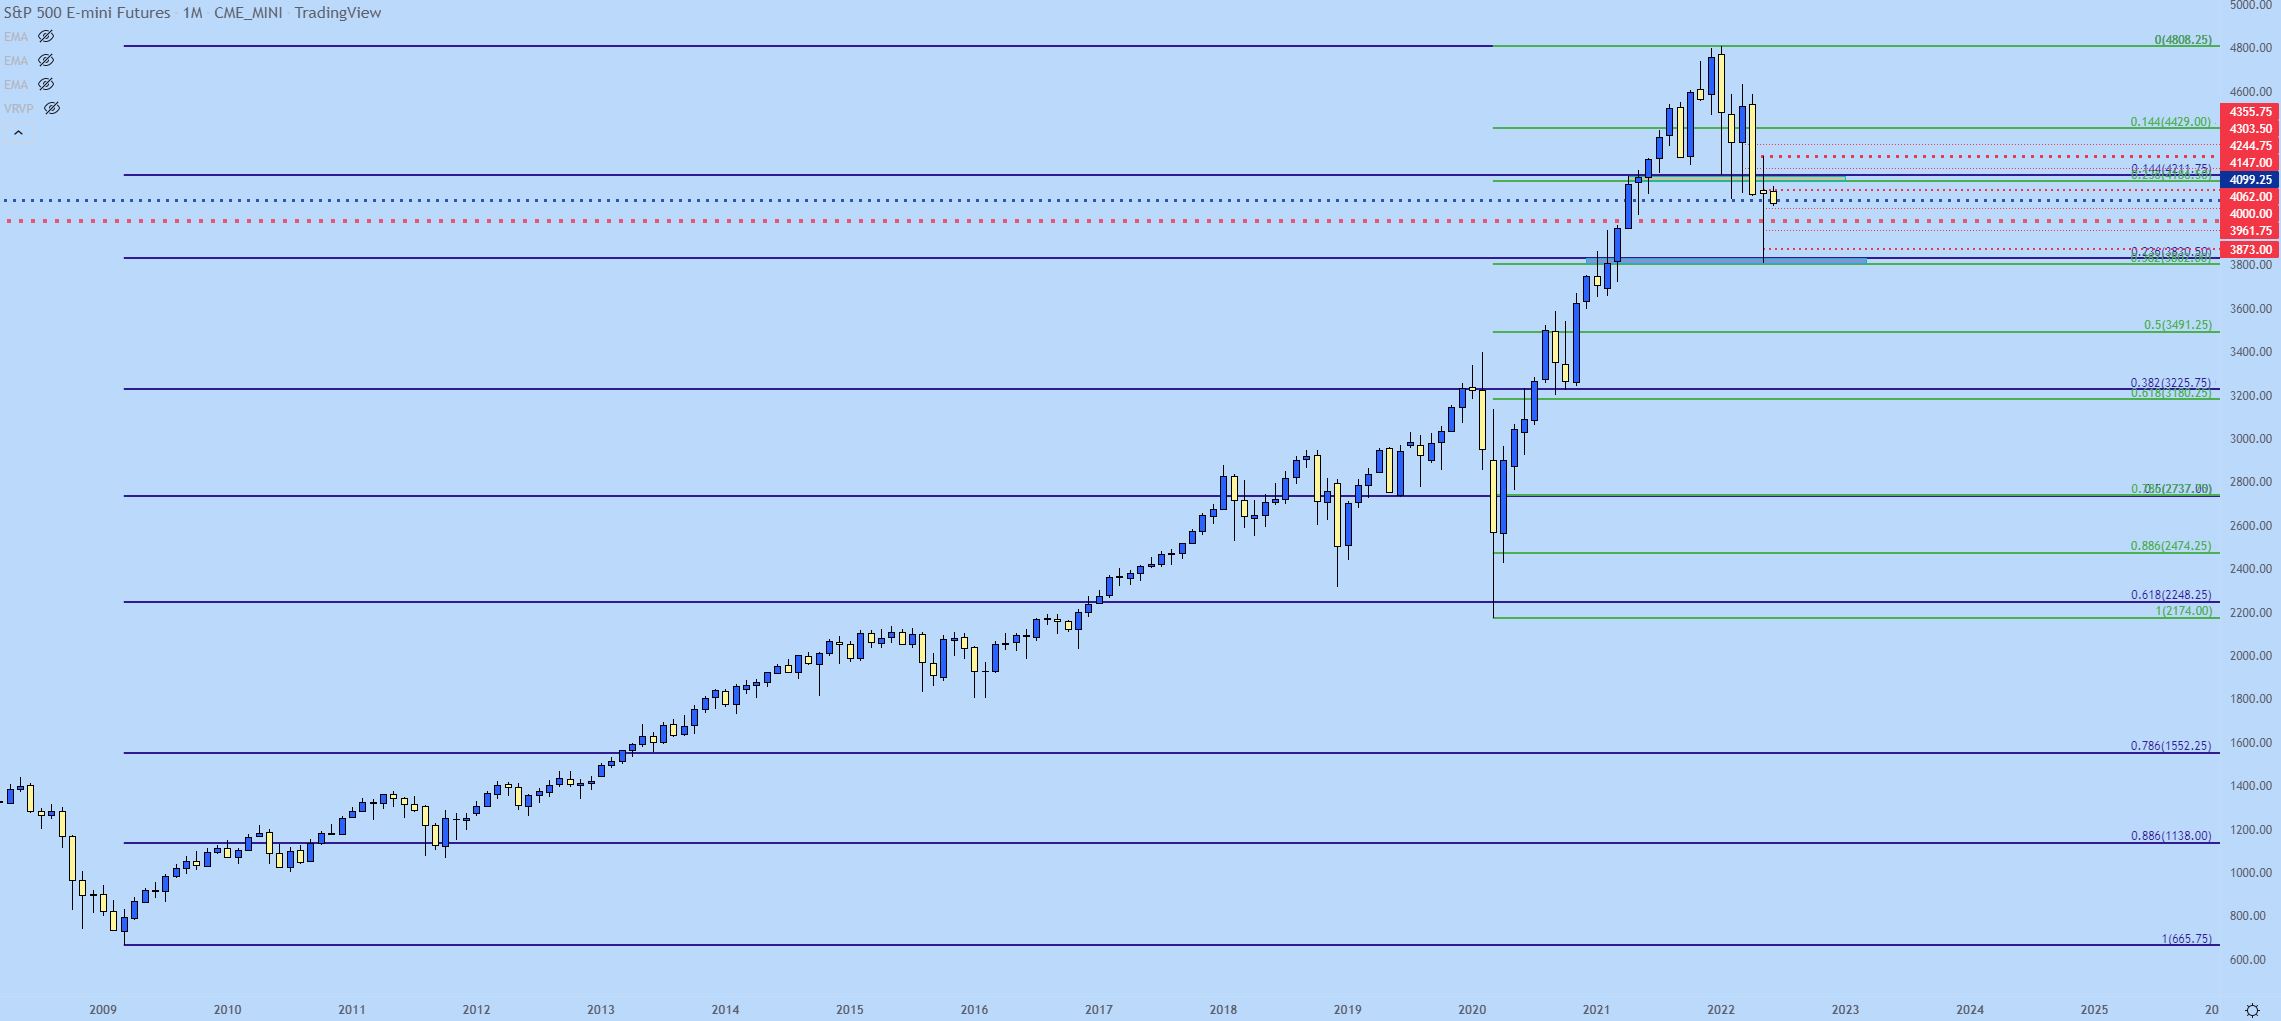
Chart prepared by James Stanley; S&P 500 on Tradingview
S&P 500 Shorter-term
So, we got the late-month retracement, similar to March. And now the door has opened into June and we have some important considerations to take into play. Namely, the FOMC rate decision is right around the corner. The Fed hasn’t even started to sell bonds from their portfolio and as I’ve been tracking so far this year, QT seems to be the big factor of concern for global markets.
The Fed goes into a blackout period after this weekend, meaning that there’ll be no more Fed-speak ahead of the June rate decision. And before we get there, tomorrow produces a Non-farm Payrolls report out of the US that will likely generate considerable attention.
At this point the S&P 500 has started to put in a series of lower-lows and lower-highs on shorter-term charts but, at this stage, those moves remain within prior ranges.
But, given the gyration in this range from last month, there are a few levels of note that could be workable for short-term strategy. The level of 4101 was big and prices are currently testing through that. This exposes the next spot of short-term support which I’m plotting around 4062. That exposes the next major spot of support around the 4000 psychological level. If sellers can re-engage back below that level, the bear trend will start to look more attractive again, particularly from longer-term charts as sellers would be making a bit statement by fading out even more of that late-month bounce.
S&P 500 Four-hour Price Chart
(Click on image to enlarge)
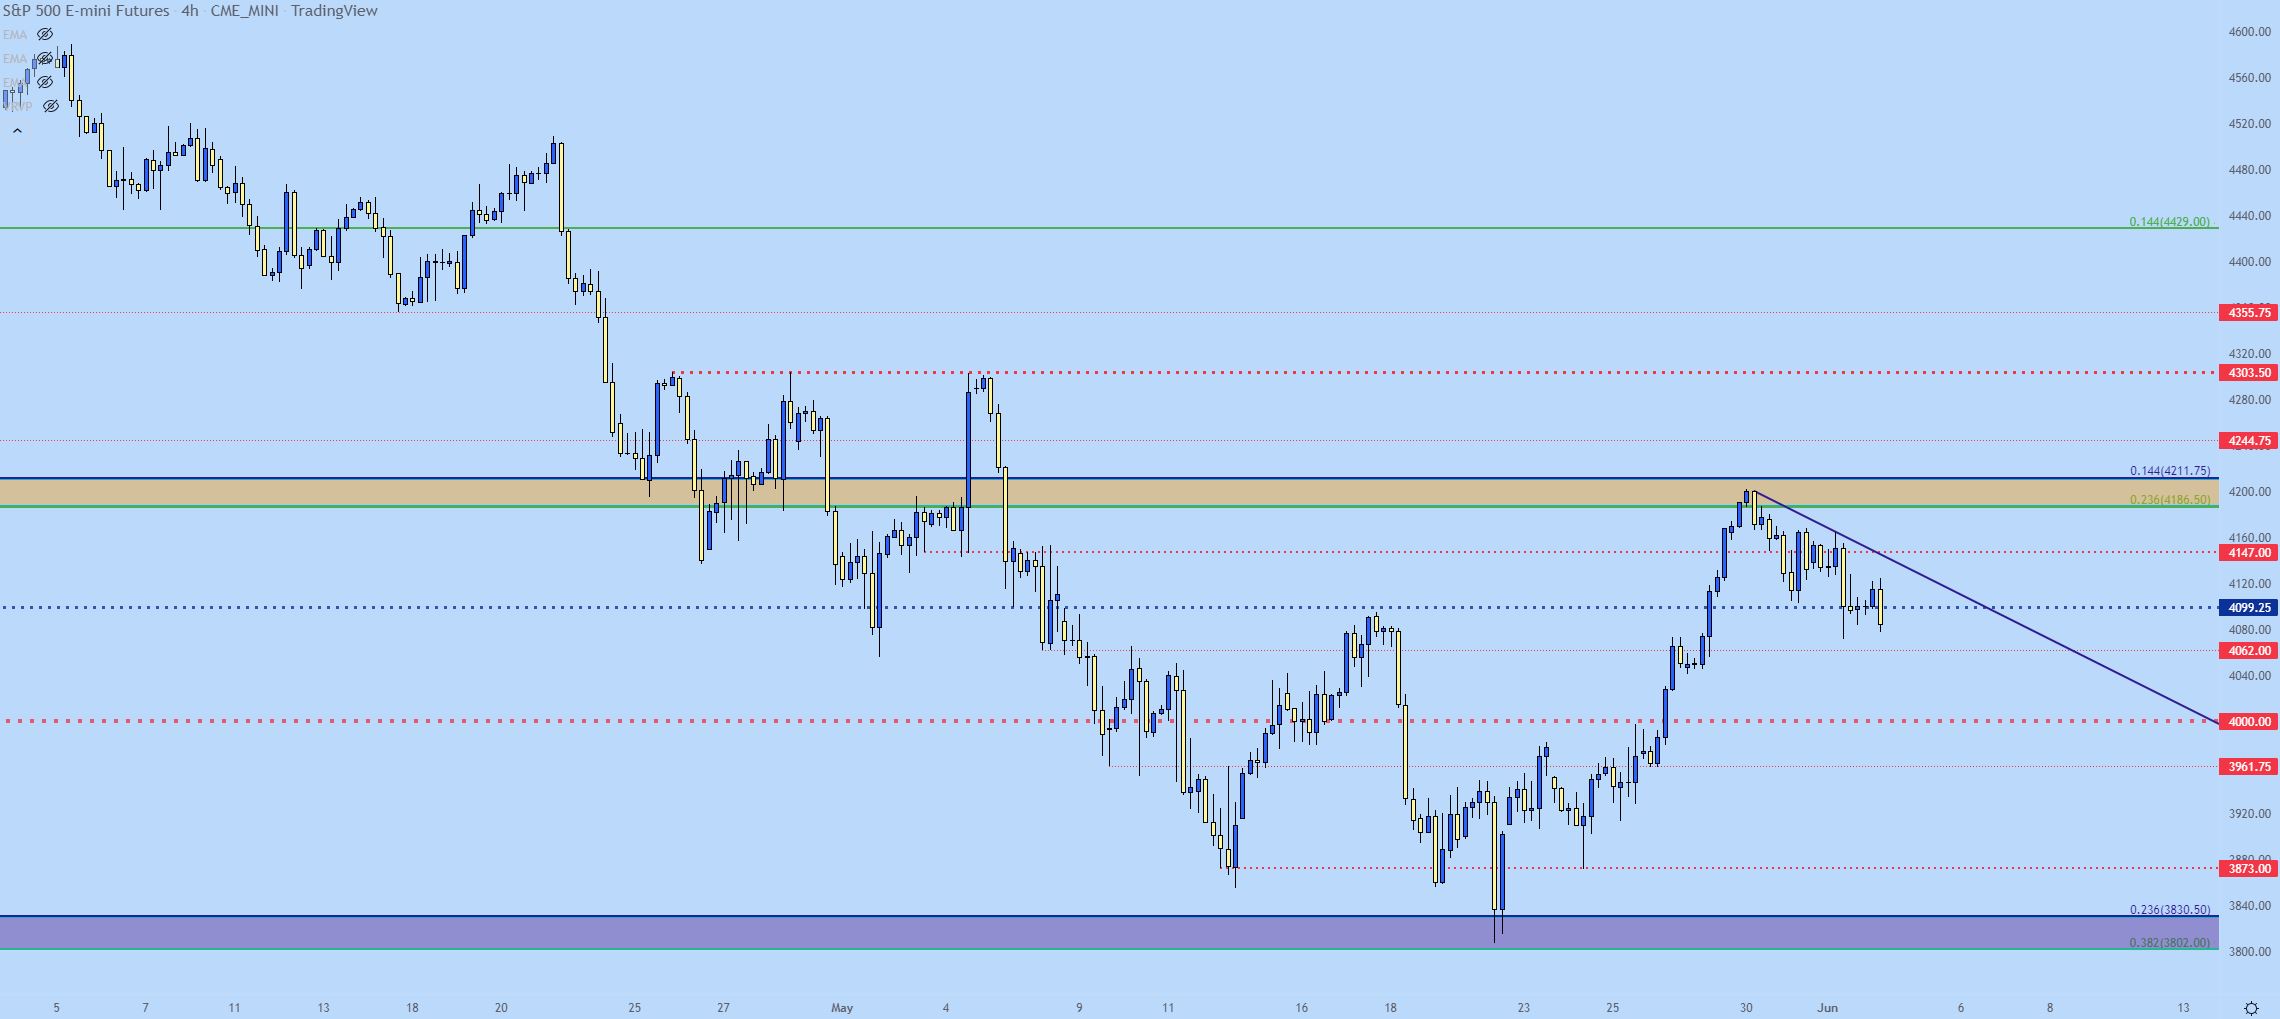
Chart prepared by James Stanley; S&P 500 on Tradingview
Disclosure: See the full disclosure for DailyFX here.


