S&P 500, Nasdaq, Dow Snap Back - Is The Party Over?
U.S. stock indices plunged after a negative opening gap today. The S&P 500 opened below the 50% Fibonacci retracement (or the 50% midpoint of the 2022 range). Risk aversion is calling into question whether last Friday's negative tone was just a breather or the start of something more. What is certain is that in the absence of major US data on the economic calendar, volatility has been increasing after the massive ramp in equities from the June low. Investors are looking ahead to tomorrow's PMIs and this week's Jackson Hole Economic Symposium, with Chair Powell scheduled to speak on Friday.
At the close, the Dow dropped 1.91%, reaching the lowest level since June, and the Nasdaq fell 2.66%, touching levels not seen in three weeks. This comes after a strong rally had developed from June lows, apparently driven by the hope that the Fed may be nearing a point of pause or pivot in their rate hike strategy. The negative sentiment has also been reflected in the US Treasury yield curve, as it showed rising yields across all maturities and gave the US dollar index (DXY) a drive to appreciate during the day. In related moves, Gold sank 0.85% and the euro depreciated to 0.9926.
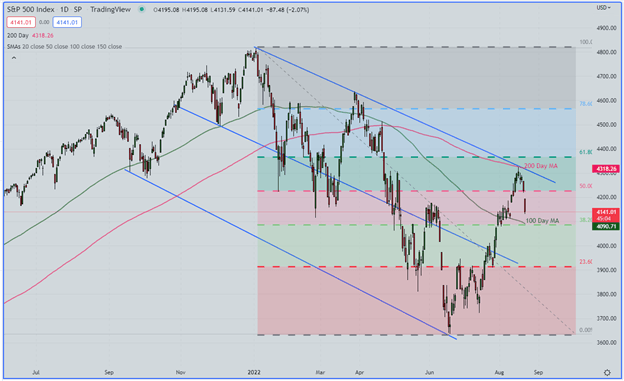
As we looked at last week, the bullish trend in the S&P 500 finally started to find sellers after re-engaging with the 200-day moving average. For today, the S&P 500 lost 2.14%, which was its worst day in two months, bringing the running tally to 4.3% from last week’s high. All the sectors of the index fell during today’s trading session. The Technology and Consumer Discretionary sectors led the declines as they lost more than 2.7% each. Markets are worried about the economic situations in Europe and China. The Chinese Central Bank cut interest rates for the second time in a week, fueling concerns about Chinese real estate and the ramifications of a larger slowdown there. China has been flirting with issues in real estate since last year’s well-publicized problems around Evergrande. In the case of Europe, investors have seemingly shrugged off the risks around energy and the problems they may face this coming winter. Gazprom, the Russian state-owned energy company, just announced another round of supply disruptions due to maintenance.
Regarding technical levels for the S&P 500, after gapping down at the open at 4,227, the index is heading to test the 100-Day Moving Average which also shows confluence with the 38.2% Fibonacci retracement level at 4,090.70. The 200-Day Moving Average at 4,325 remains as topside resistance.
S&P 500 DAILY PRICE CHART

S&P 500 Daily Chart prepared using TradingView
More By This Author:
S&P 500 Continues To Retreat As Traders Await Jackson Hole Symposium
Euro Price Action Setups: EUR/USD Persistence, EUR/JPY Resistance
Euro Price Forecast: Parity Back On The Table For EUR/USD
Disclosure: See the full disclosure for DailyFX here.


