
S&P 500, Nasdaq, Dow Jones Outlook: Equities Cautious Ahead Of US CPI
Fundamental Risks Rise Ahead of Big Week of Economic Data
The economic calendar is loaded this week which will likely continue to influence volatility and sentiment for the remainder of the year. With S&P 500, Dow Jones, and Nasdaq futures making modest gains, US CPI data and FOMC are among the data points that are expected to be monitored closely.
As major central banks prepare for the last policy meetings for 2022, inflation and interest rates have remained key catalysts for price action. While the Federal Reserve, BoE (Bank of England), and ECB (European Central Bank) remain on tap, this week could be particularly challenging for stock indices.
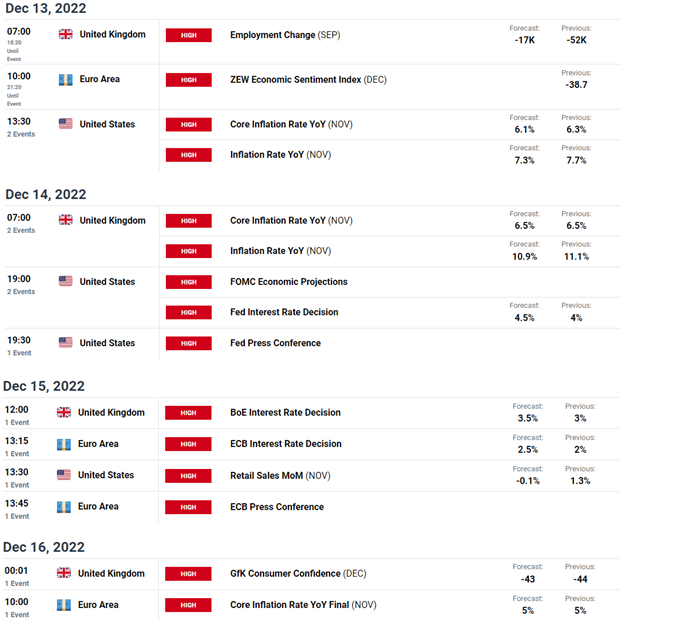
DailyFX Economic Calendar
SPX (US S&P 500) Technical Analysis
With S&P 500 futures failing to rise above the trendline resistance of the falling wedge formation early this month, a rejection of the 4110 handle allowed bears to keep prices in check. After dropping below the 200-day MA (moving average) at 4038, prices remained under pressure before bottoming out at 3914.
For the short-term move to break out of the current zone of consolidation, a breach of the 4000 psychological level could drive upside potential towards wedge resistance around 4110.
But, with the fundamental backdrop still weighing heavily on risk assets, the downside move may accelerate if SPX 500 drops below imminent support at 3956. With the next zone of support forming around 3912.50, the bearish move may be validated if prices break below 3880.
S&P 500 (SPX) Daily Chart
(Click on image to enlarge)
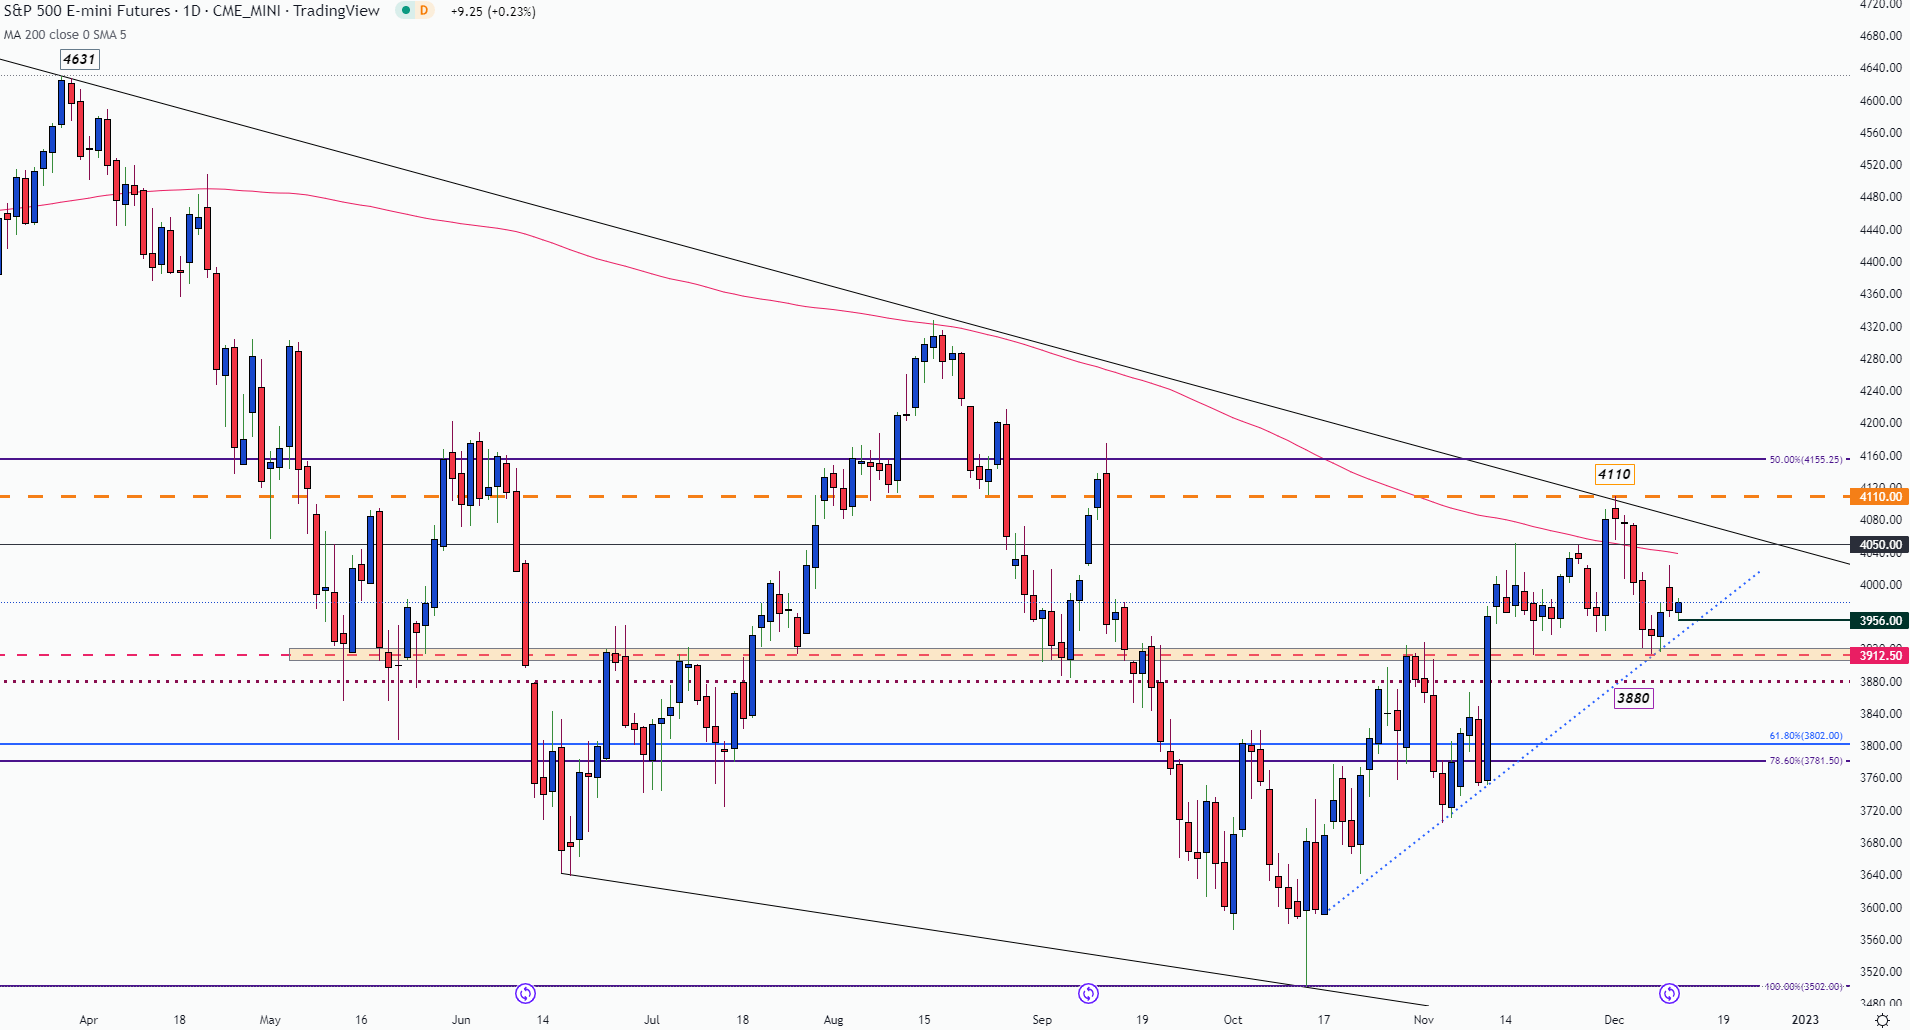
Chart prepared by Tammy Da Costa using TradingView
Nasdaq (US Tech 100) Technical Analysis
As the 11700 psychological level remains as key resistance for the Nasdaq 100, the tech-heavy index is struggling to make any major moves. While this level also marks the mid-point of the 2020 – 2021 move, the 78.6% Fibonacci of the 2022 range holds as resistance around 11785. With the 11930 and 12000 levels forming additional barriers above current levels, the 11500 psych handle supports a move lower, just above the 50-day MA (moving average) at 11435.
Nasdaq 100 Daily Chart
(Click on image to enlarge)
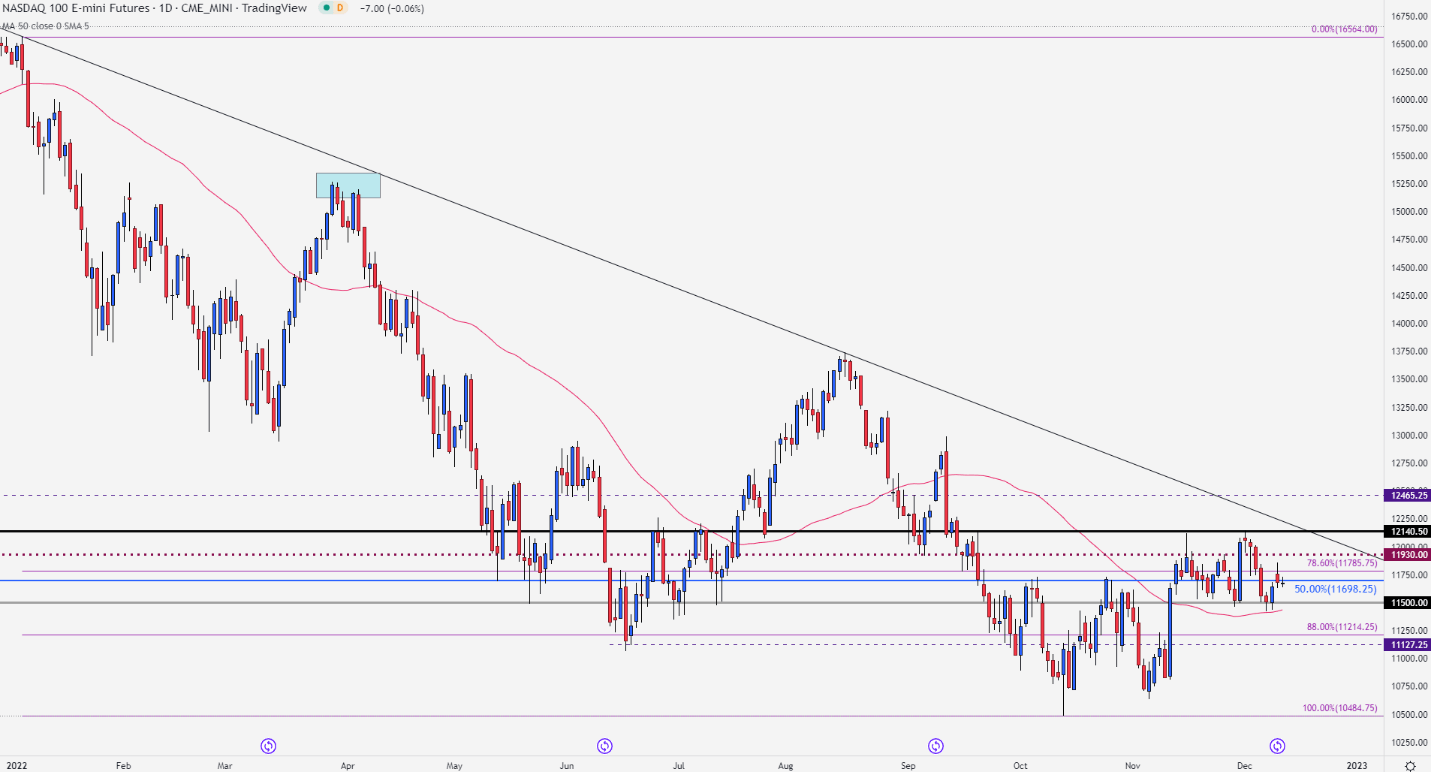
Chart prepared by Tammy Da Costa using TradingView
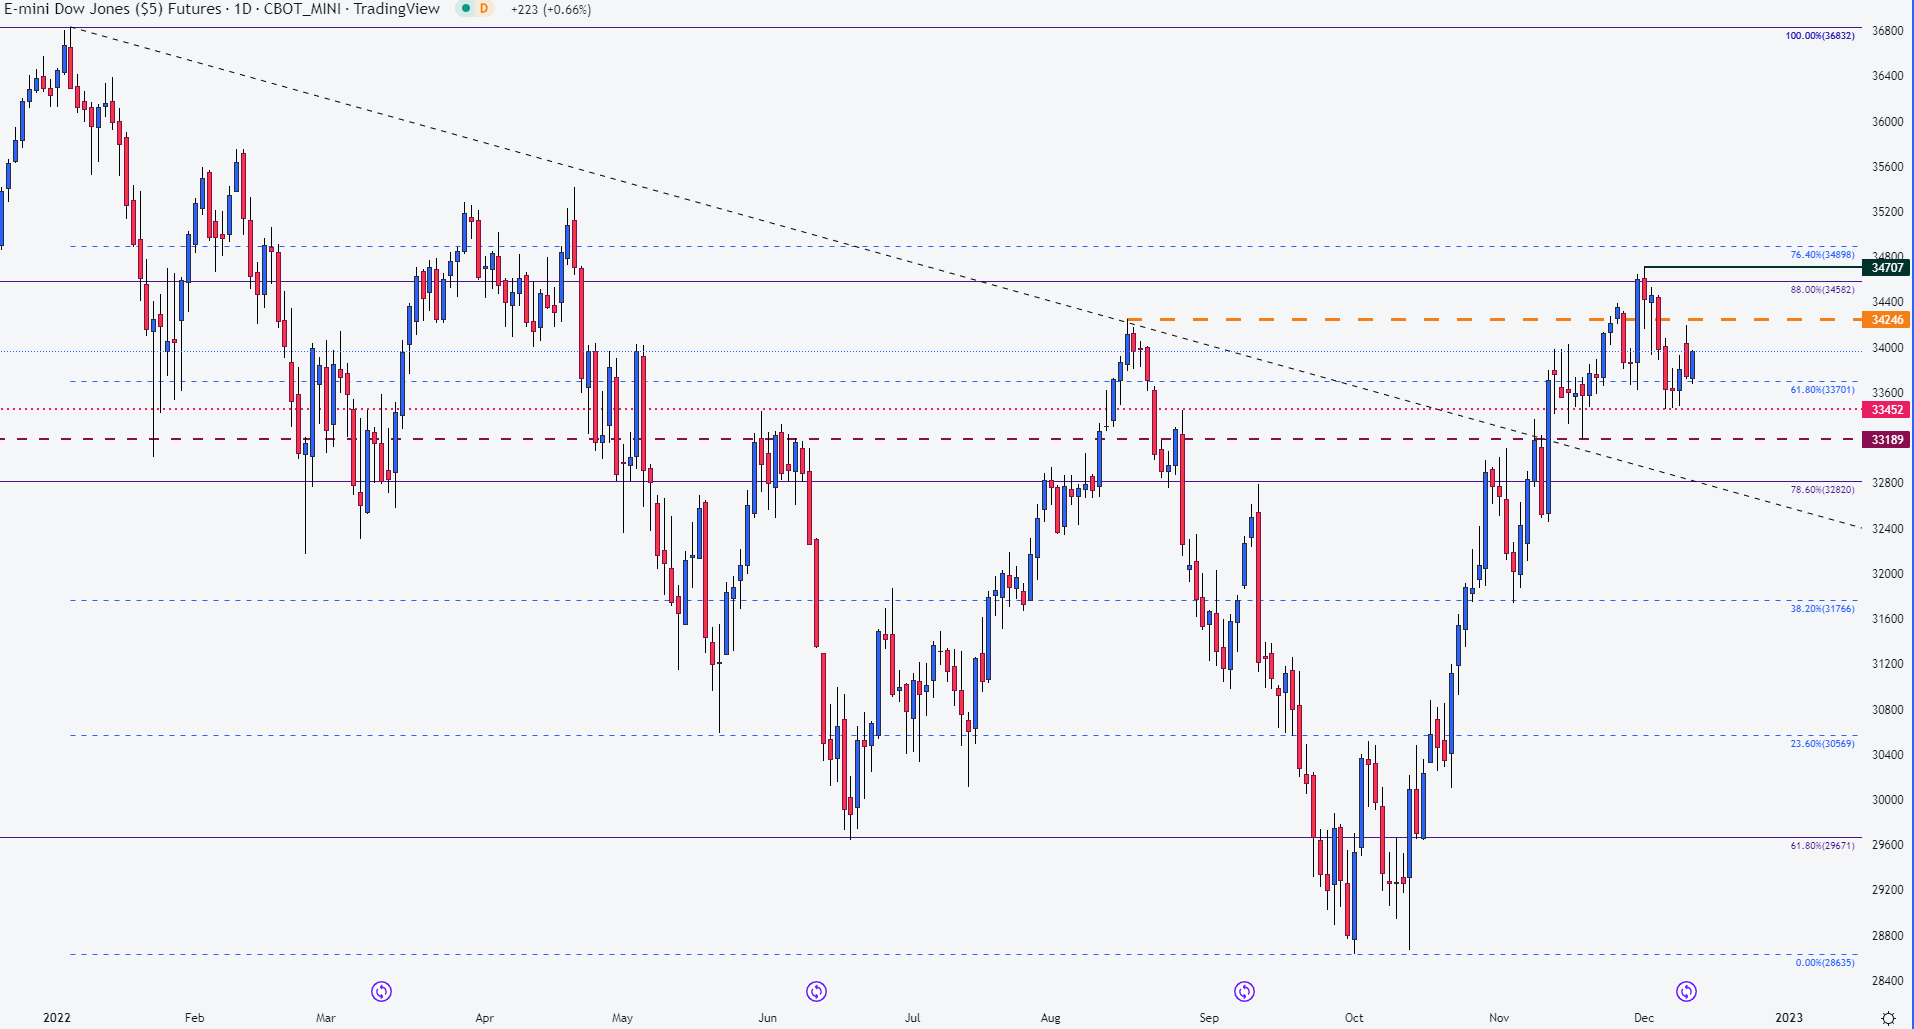
Dow Jones Analysis
While Dow futures hover above 33700, a move lower could see DJI dropping back to the December low at 33452. Meanwhile, bullish momentum may gain if prices hold above the 34000 psychological resistance, opening the door for the August swing high at 34246.
(Click on image to enlarge)
More By This Author:
Dax Technical Outlook: German Equities Weighed Down By Bleak OutlookS&P 500, Nasdaq, Dow Jones: US Equity Futures Sink After Recent Gains
Japanese Yen Technical Outlook: USD/JPY, EUR/JPY, GBP/JPY Setups


