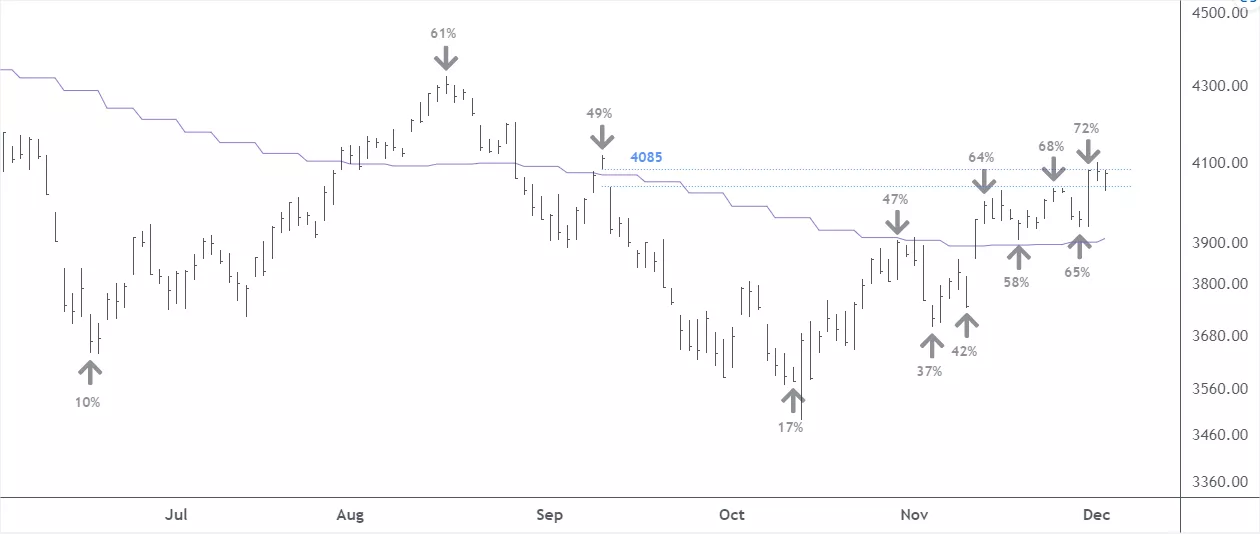
S&P 500 Index At Critical Intersection Point

Below is a daily chart of the S&P 500 index. After Friday´s close, we have a three bar (day) triangle pattern which often leads to a breakout to the upside or downside the following day. Many market participants are watching closely the 4100 level; for me 4085 is a critical intersection point.
The purple line on the chart is a long-term moving average and the arrows show some of the important swing highs and lows.
Above/below the arrows I list the percent of S&P 500 stocks which are above their long-term moving averages (LTMAs). The sequencing from October 12 is encouraging; with each new swing high and low, more stocks are getting above their LTMAs.
Will be interesting to see how next week plays out in the U.S. stock market.

More By This Author:
Marel's Stock Price Rebounding But Nearing An Important Inflection Point
Semiconductor Index At Important Inflection Point
Russell 3000 Index Moving Sideways Between 2219 And 2077


