
S&P 500 Futures Index Approaching Bearish Head & Shoulders Neckline
My post of January 31 contained Pivot Point support and resistance levels/targets for February for the S&P 500 Index (SPX).
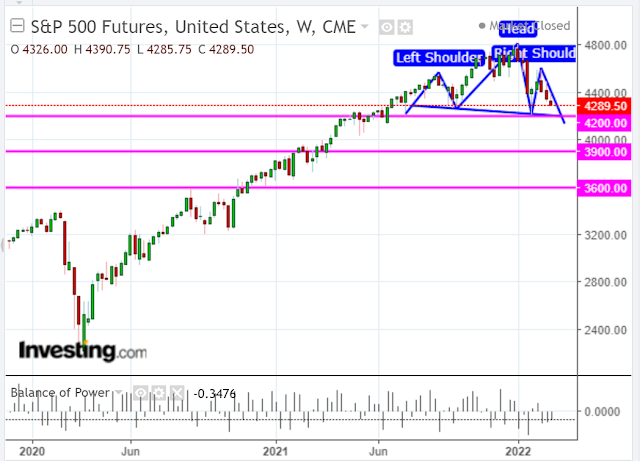
The following weekly chart of the S&P 500 Futures Index (ES) shows that price is in the midst of forming a bearish Head and Shoulders pattern.
The sloping neckline on this formation sits around 4200, which is just below February's SPX S1 support level.
Should price break below that level, the next levels of support are around 3900 and 3600, respectively...just below SPX S2 and S3.
The Balance of Power is still held by the sellers...and will continue if price breaks and holds below 4200.
If not, price will continue its volatile, directionless whipsaw swings in both directions within this typical topping pattern.
Disclaimer: All of my posts (and charts) contain solely my own technical analyses/opinions/observations (which may contain errors or omissions) of a variety of markets and are ...
more


N.B. See important UPDATE on my Blog at this link.