
S&P 500 Forecast: Break Out Or Fake Out?
S&P 500 FORECAST: BREAK OUT OR FAKE OUT?
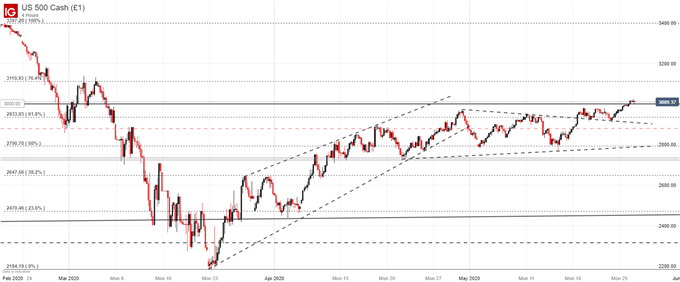
The S&P 500 crossed the 3,000 mark on Tuesday, trading above the level for the first time since March 6. To be sure, the price-point possesses notable psychological significance and its failure to keep price beneath may suggest the index is headed higher still. That being said, risks to the rally remain and false breaks have occurred before.
S&P 500 PRICE CHART: 4 – HOUR TIME FRAME (FEBRUARY – MAY)
First and foremost is the growth-shattering effects of coronavirus. By this time, investors and economists have become well acquainted with the slowdown in economic activity, but the market is still recognizing new shocks almost daily as dominoes continue to fall.
Just recently, Hertz rental car services and Latin America’s largest airline, Latam, filed for bankruptcy – highlighting the ongoing struggle of many companies despite the early stages of reopening. Therefore, many corporations may remain at risk for some time, so a surprise shock from major insolvency is essentially a constant risk to the rally. As is stands, these filings have failed to meaningfully dent sentiment, but should they continue to pile up, the threat to financial institutions may become too large to ignore.
Elsewhere, tensions between the United States and China have flared and recent developments in Hong Kong threaten to enflame the conflict further. The United States has already moved to require additional oversight of Chinese stocks listed on US exchanges, but the tit-for-tat nature of prior trade conflicts suggests China may respond with their own measures. Either way, the deteriorating relationship between the world’s two largest economies may serve to create significant uncertainty in the stock market in the weeks ahead.
Thus, while the recent price move suggests the S&P 500 is enjoying an accommodative fundamental backdrop, there are many risks at hand – each of which could easily undermine risk appetite in an instant. As the S&P 500 looks to press higher in the meantime, however, subsequent technical resistance may reside around the 3,110 level which helped stalled two recovery attempts in early March.
On the other hand, potential support may exist near 2,933 and possibly atop the descending trendline that marks the various tops and bottoms of the last month. While it is important to note the bullish implications of a higher high and a break above 3,000, it is my opinion the S&P 500 remains at significant risk of a medium-term reversal lower so the outlined support may prove crucial in the weeks ahead.


