S&P 500 Dividend Aristocrats: Defensive Attributes, Growing Dividends, And Competitive Yields
Driven primarily by the U.S. Federal Reserve’s plan to tighten monetary policy and curb inflation, and compounded by geopolitical tensions and earnings, the S&P 500® finished January down 5.26%.
Market participants contemplating how to position themselves for the path ahead should not overlook dividend growth strategies such as the S&P 500 Dividend Aristocrats®. To be included in this index, companies must be members of the S&P 500 and have increased dividends for at least 25 consecutive years.
Since December 1989, the index has outperformed the S&P 500 with lower volatility.
(Click on image to enlarge)

Higher-Quality Companies
With looming inflation concerns and the prospect of further volatility, the case for dividend growth strategies may be particularly compelling. The ability to consistently grow dividends every year through different economic environments can be an indication of financial strength and discipline.
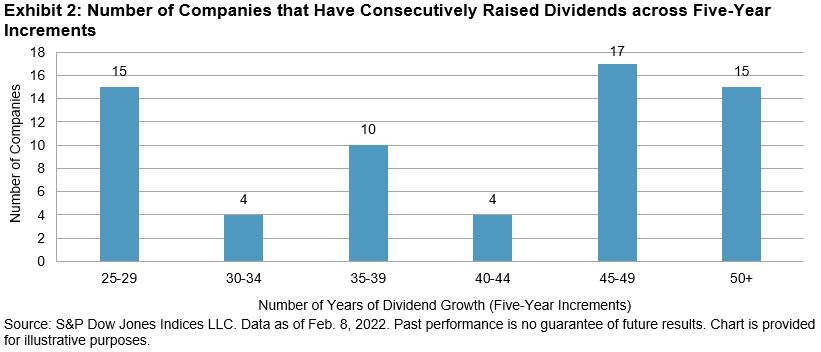
As Exhibit 2 shows, over half of the current constituents in the S&P 500 Dividend Aristocrats have grown their dividends for more than 40 years.
(Click on image to enlarge)

The defensive qualities of the S&P 500 Dividend Aristocrats can be observed by examining the historical downside capture ratio in Exhibit 3. A downside capture ratio of less than 100 indicates that a strategy has lost less than its benchmark during months when the benchmark return was negative.
(Click on image to enlarge)

Inflation Protection
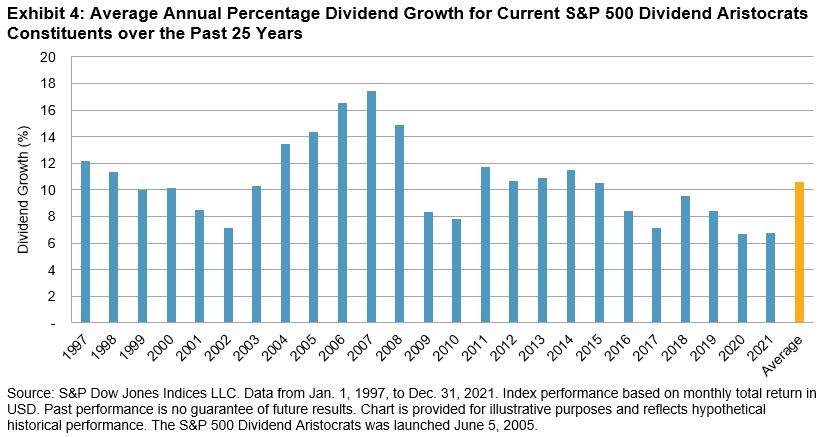
Inflation is the enemy of bonds because it erodes the value of their fixed coupons. However, companies have the advantage of being able to grow their dividends to outperform inflation over the long term. Exhibit 4 shows that dividends paid by current constituents of the S&P 500 Dividend Aristocrats have grown on average by 10.6% a year over the last 25 years compared with ~2.25% per year for inflation.
(Click on image to enlarge)

Attractive Yield Potential
While potential rate hikes may make equities less attractive on a yield basis, dividends can still play an important role in generating yield if interest rates remain low on an absolute basis.
While other higher-yielding dividend strategies exist, they often come with higher risk. The S&P 500 Dividend Aristocrats, however, tend to exhibit lower risk by including only companies that have increased dividends for at least 25 consecutive years, while still delivering higher yields than the benchmark. As of year-end 2021, the S&P 500 Dividend Aristocrats had an indicative yield of 2.24% versus 1.30% for the S&P 500 (see Exhibit 5).
(Click on image to enlarge)

Risk Control
Market participants looking to further reduce risk and drawdowns may want to consider risk control strategies. These strategies dynamically adjust exposure to an index, such as the S&P 500 Dividend Aristocrats, in an effort to target a stable level of volatility in all market environments. When volatility increases, the risk control index moves out of the underlying index and into cash. The opposite occurs when volatility decreases.
Exhibit 6 shows a detailed risk/return comparison of the S&P 500 Aristocrats Daily Risk Control Indices from May 31, 1990, to Jan. 31, 2022. The three largest drawdowns were dramatically reduced across all four volatility targets.
(Click on image to enlarge)

With inflation and uncertainty in the air, dividend growth strategies offer a way to measure higher-quality companies, growing dividends, and competitive yields. Market participants looking to layer on additional protection against volatility may also want to consider risk control strategies.
Disclaimer: For more information on the risk-adjusted performance of actively managed funds compared with their benchmarks in 2018, read our latest more


