S&P 500 Closes Week With Strong Gains, Overcoming Hawkish Fed Comments, Consumer Sentiment Concerns
Wall Street is set to finish the week with gains, as the S&P 500 prints solid gains above the 4,400 figure, shrugging off a deteriorated consumer sentiment, while US Treasury bond yields stabilized after climbing more than 10 bps along the whole yield curve on Thursday.
Wall Street ends week on a high note as S&P 500 surpasses 4,400, despite mixed economic signals and Fed's hawkish stance
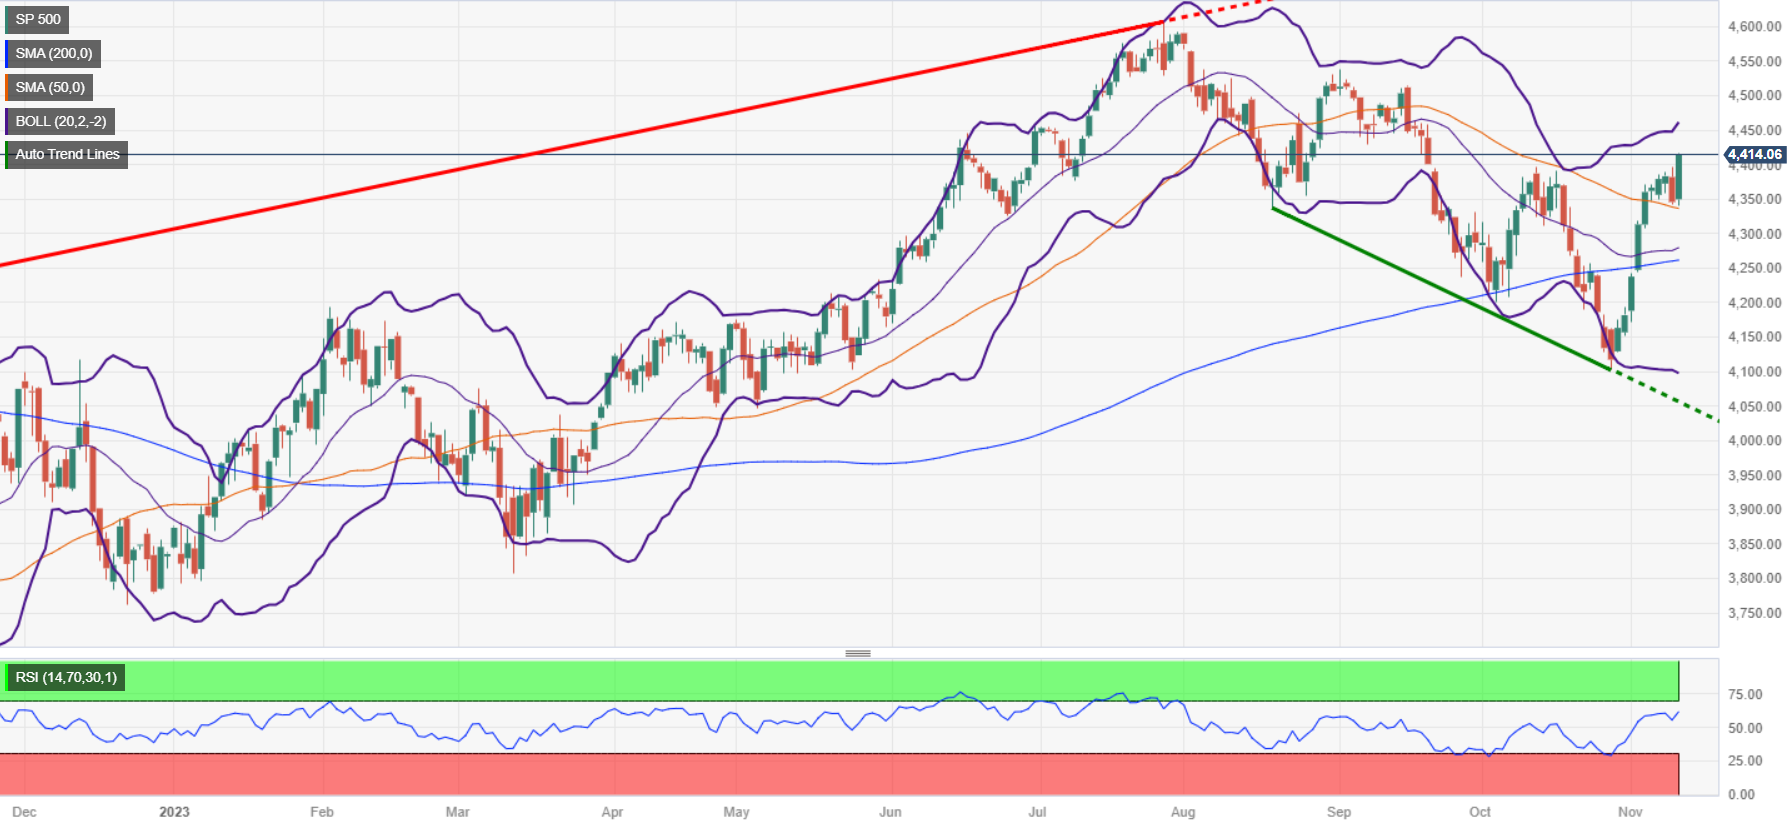
At the time of writing, the S&P 500 is gaining 1.54% late Friday, staying at 4,414.57, on track for seven-week gains, while the Nasdaq 100 rises 2.05%, at 13,798.56. The laggard was the Dow Jones Industrial, which ended up 1.20%, at 34298.
On Thursday, hawkish remarks by the US Federal Reserve (Fed) Chair Jerome Powell were brushed aside by traders, who remain reluctant to accept additional rate hikes by the US central bank. In the meantime, a poll of the University of Michigan (UoM) revealed that Consumer Sentiment deteriorated, while American households upward revised inflation expectations from now to a one-year horizon at 4.4%, while for five years, at 3.2%.
Given the backdrop, the 10-year US Treasury bond yields failed to gain traction and finished almost flat at 4.618%, while the Greenback dropped 0.09%, as measured by a basket of six currencies, namely the US Dollar Index at 105.79.
Sector-wise, the leaders were Technology, Communication Services, and Consumer Discretionary, each added 2.69%, 1.67%, and 1.66%, respectively. The laggards were Utilities, Health, and Consumer Staples, gaining 0.52%, 0.60% and 0.66%, each.
Investors remained focused on the Federal Reserve, as Atlanta Fed President Raphael Bostic stated that policymakers can bring inflation to its goal with the current level of the fed funds rate. Meanwhile, San Francisco Fed President Mary Daly pushed against dovish postures, adding the Fed could need to hike again if progress on inflation stalls.
Next week's economic docket will feature US inflation data, unemployment claims, and Fed speaking will provide some clues regarding the US economy's status.
S&P 500 Price Analysis – Daily Chart
S&P 500 Technical Levels
SP 500
| OVERVIEW | |
|---|---|
| Today last price | 4414.06 |
| Today Daily Change | 68.25 |
| Today Daily Change % | 1.57 |
| Today daily open | 4345.81 |
| TRENDS | |
|---|---|
| Daily SMA20 | 4275.22 |
| Daily SMA50 | 4338.47 |
| Daily SMA100 | 4402.73 |
| Daily SMA200 | 4259.54 |
| LEVELS | |
|---|---|
| Previous Daily High | 4395.9 |
| Previous Daily Low | 4341.89 |
| Previous Weekly High | 4371.8 |
| Previous Weekly Low | 4128.51 |
| Previous Monthly High | 4396.16 |
| Previous Monthly Low | 4102.02 |
| Daily Fibonacci 38.2% | 4362.52 |
| Daily Fibonacci 61.8% | 4375.27 |
| Daily Pivot Point S1 | 4326.5 |
| Daily Pivot Point S2 | 4307.19 |
| Daily Pivot Point S3 | 4272.49 |
| Daily Pivot Point R1 | 4380.51 |
| Daily Pivot Point R2 | 4415.21 |
| Daily Pivot Point R3 | 4434.52 |
More By This Author:
EUR/GBP Ekes Out A New Six-Month High At 0.8755 To Close Out A Week Of Straight GainsGold Price Analysis: Hawkish Fed Pushed Gold Further Down, XAU/USD Tested $1,930
Crude Oil Looking To Firm Up A Bounce From $76
Disclosure: Information on this article contains forward-looking statements that involve risks and uncertainties. Markets and instruments profiled on this page are for informational purposes ...
more


