
Snap Dips Toward A Key Level: What Could Be Next?

Image: Courtesy Snap
Snap Inc. SNAP shares are trading down Monday, pushing lower back toward resistance. There looks to be no evident company news to explain the drop in share price.
Snap was down 5.26% at $70.67 at last check Monday.
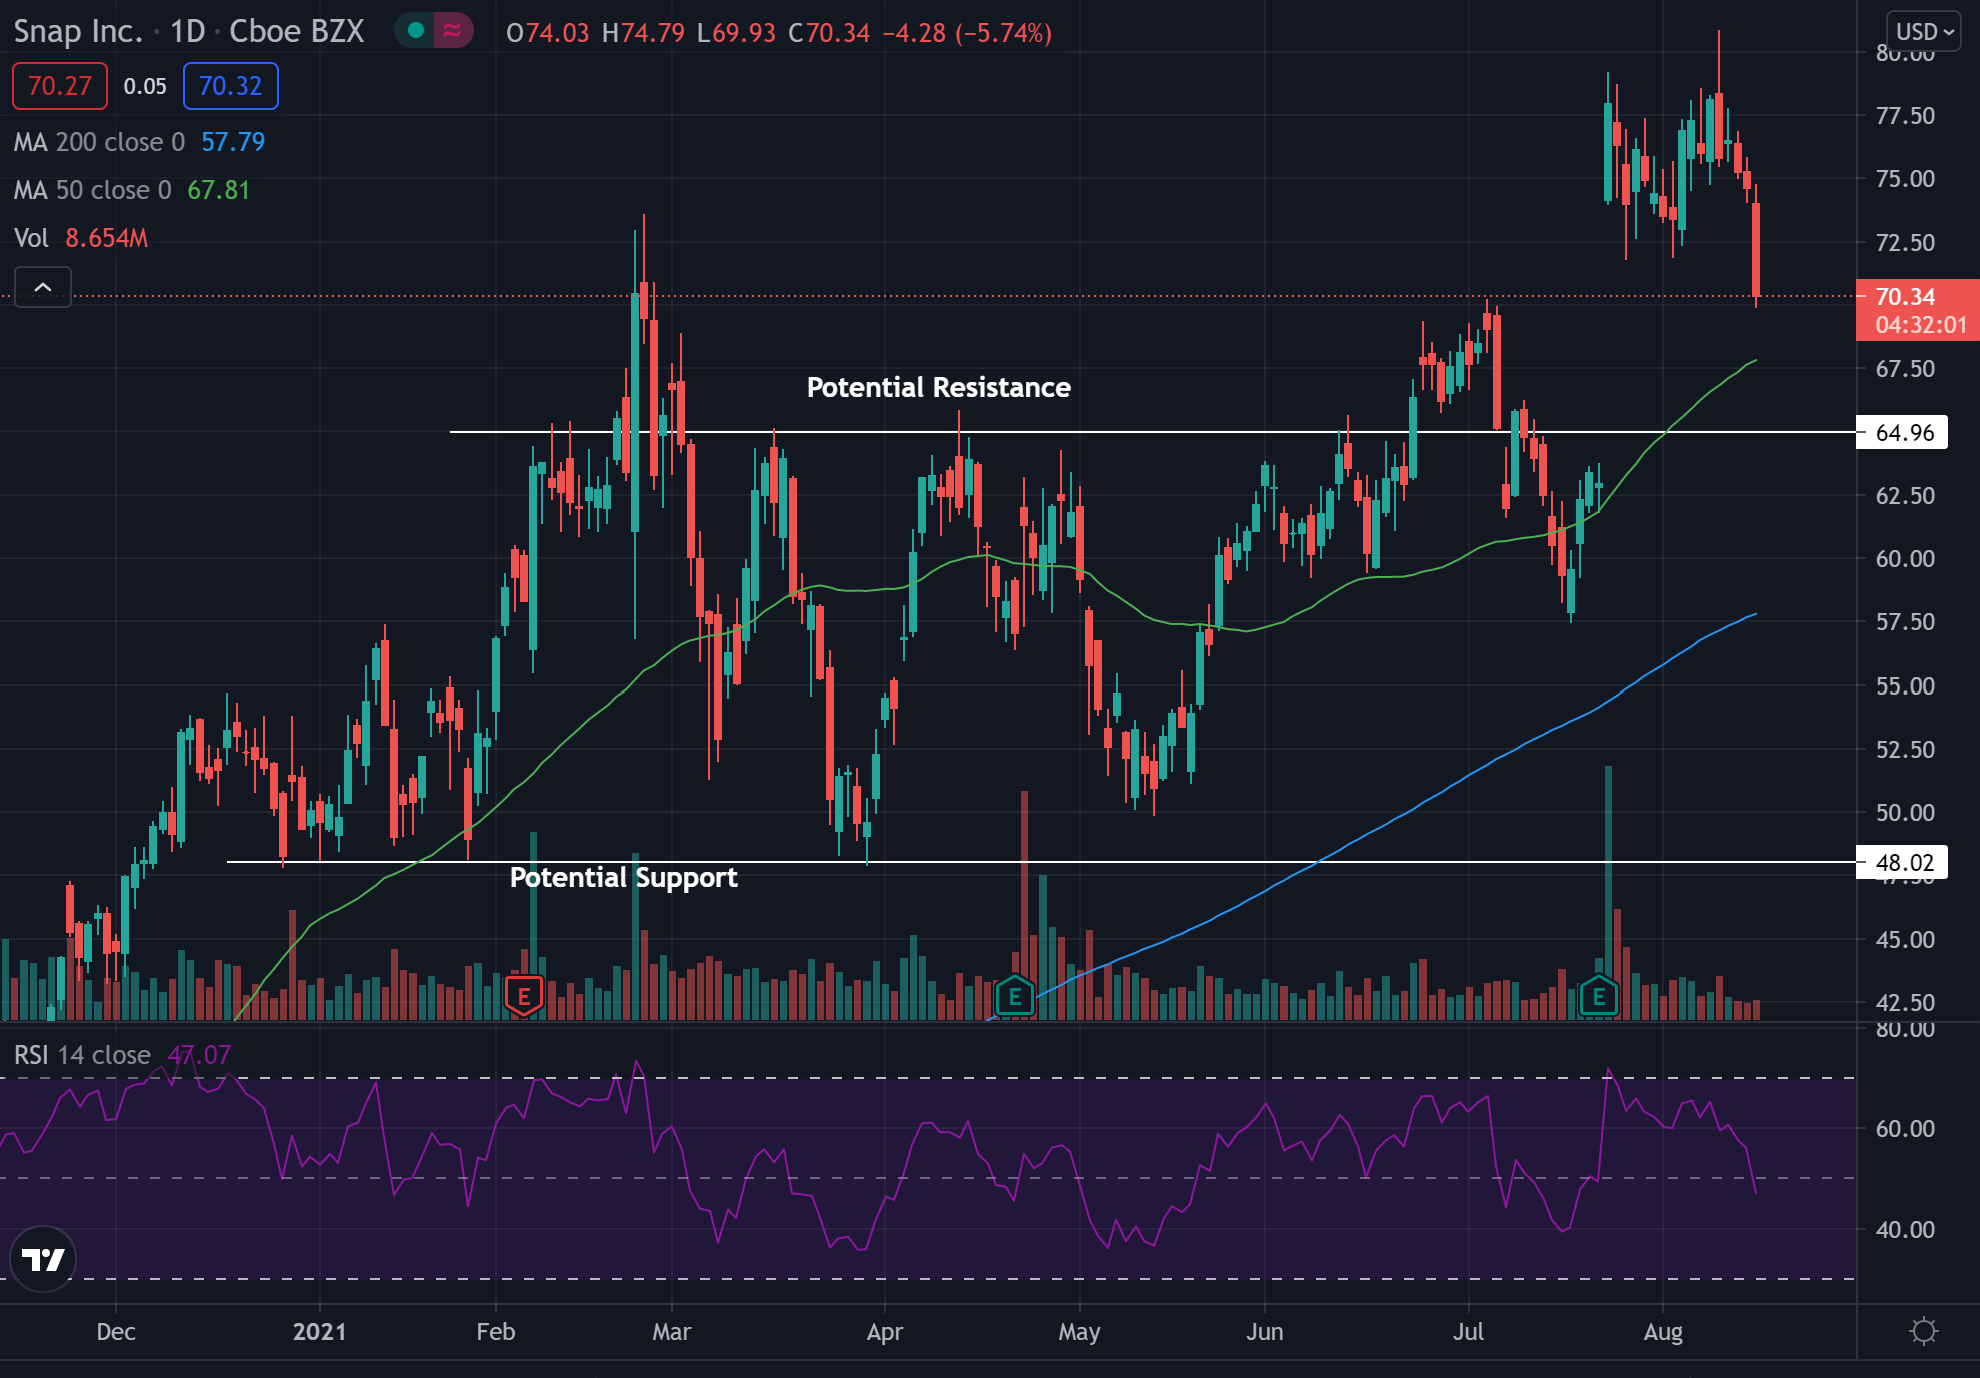
Snap Daily Chart Analysis
- Shares broke out of a sideways channel, but are now falling back toward a previous resistance level.
- The stock is trading above both the 50-day moving average (green) and the 200-day moving average (blue), indicating the sentiment in the stock has been bullish.
- Each of these moving averages may hold as a possible area of support in the future.
- The $68 has held as resistance in the past and may continue to in the future, while the $48 level has held as support in the past and may hold again.
- The Relative Strength Index (RSI) has been moving lower and now moved below the mid-line. The RSI now sits at 47, meaning that there has been more sellers moving into the stock lately.
(Click on image to enlarge)
What’s Next For Snap?
Bullish traders would like to see the stock bounce off the old resistance line and hold it as support before starting to form higher lows.
Bears would like to see the stock fall lower and break back into the channel pattern. Then they would like to see the stock fall further and break below the $48 support.
© 2021 Benzinga.com. Benzinga does not provide investment advice. All rights reserved.
How did you like this article? Let us know so we can better customize your reading experience.

Comments
Leave a comment to automatically be entered into
our contest to win a free Echo Show.

