
Skyworks Solutions: Oversold And Hitting Support At The Lower Rail Of A Trend Channel
From the end of 2018 through its high in April, Skyworks Solutions (SWKS) saw its stock gain over 200%. There were up and down cycles throughout that stretch, but we see a trend channel formed in the second half of 2019 with the lower rail connecting the lows from September ’19, the lows from Q4 2020, and the recent low. The big drop in the first quarter of 2020 saw the stock break below the lower rail by a considerable margin, but that was during the overall market meltdown.
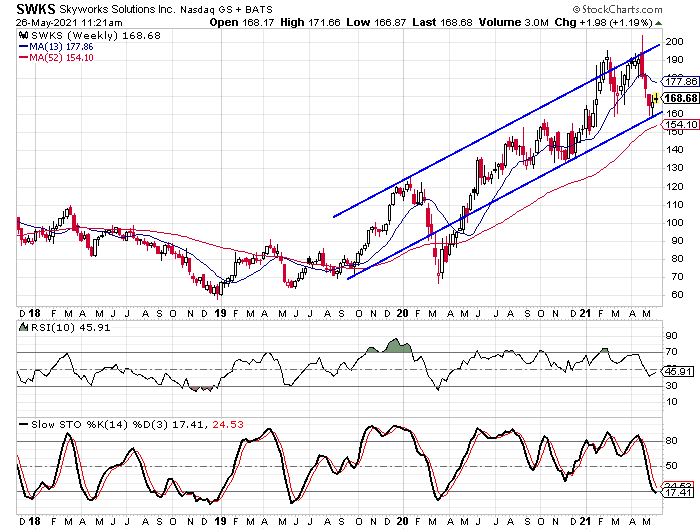
This pattern is one I have seen on a number of stocks and I believe the decline in early 2020 was an anomaly that we have to look past—a black swan event. We see how the pattern was in place before the virus shocked the financial markets and has now picked up now that things are returning to normal. The upper rail of the channel isn’t as tight as the lower rail, but it still reflects the overall trend in the stock.
Over the last month, the stock has declined in three of the last four weeks and the weekly stochastic indicators are entering oversold territory and it’s the first time since March ’20 that the indicators have been this low. Before that, we have to go back to May ’19 to find the indicators as low as they are now. In both of these past two instances where the stochastic indicators were this low, the stock rallied sharply in the ensuing months.
Strong Profitability Measurements Highlight the Fundamentals
As much as like the chart and how it is setting up, the fundamentals are strong as well and that is part of the reason the stock is rated as a “strong buy” on the Tickeron Scorecard right now.
Skyworks reported fiscal second-quarter earnings results back on April 29. The company saw earnings jump 77% compared to Q2 2020 while revenue jumped 53%. Analysts expect earnings to increase by 68.4% for 2021 while revenue is expected to increase by 49.1%. Those growth rates are big increases compared to the last three years. Over the last three years, the company’s earnings have been flat while revenue has declined by 1% per year.
The earnings and revenue growth are impressive, but the profitability measurements are even more impressive. The return on equity is 25.1% and the profit margin is 33.7%. Both of those figures are well above the industry averages.
The company scores well in several categories on the Tickeron Fundamental Analysis Screener. The Outlook Rating is a 16, the Valuation Rating is a 19, and the Profit vs. Risk Rating is an 18. The current trailing P/E is 23.02 and the forward P/E is 18.38 and those two figures are below the averages for the semiconductor industry.

Analysts are Less Bullish on Skyworks than the Average Company
Turning our attention to the sentiment indicators for Skyworks, analysts aren’t as bullish on the stock as they are the average stock. There are currently 27 analysts following the stock with 16 “buy” ratings, 10 “hold” ratings, and one “sell” rating. This gives us a buy percentage of 59.3% while the average buy percentage falls in the 65% to 75% range.
There are 3.8 million shares of Skyworks sold short presently and the average daily trading volume is 2.3 million. This gives us a short interest ratio of 1.66 and that is below average. The number of shares sold short has been pretty consistent in the last six months with almost all readings showing between three and four million shares sold short. The biggest variant in calculating the short interest ratio seems to be the average trading volume. From the April 30 reading to the mid-May reading, the average trading volume jumped from 1.8 million to the 2.3 million used in the current ratio calculation.
The put/call ratio is in the average range at 1.05. There are 55,626 puts open and 52,856 calls open at this time. One interesting note about Skyworks’ put/call ratio is that it was running below 1.0 in March and then spiked higher in April ahead of the second-quarter earnings report. Throughout most of April, the ratio was above 1.4 and indicates greater pessimism than the average stock. The ratio has been trending down since the earnings report.
The overall sentiment picture is mixed with less optimism from analysts, more optimism from short sellers, and neutrality from option traders. That leaves the other two analysis styles to consider and both the fundamentals and the chart for Skyworks Solutions are pointing toward a move higher, at least in my opinion. I look for the trend higher to continue over the next few quarters and can see the stock moving back above the $200 level again.


