
Siemens Completes Wave 3 And Builds ABC Pullback
The Siemens (SIE) stock price made a bearish dip yesterday. This created a breakout below the 21 ema zone after breaking the support trend line (dotted green) already earlier.
Does this mean that the uptrend is over? Let’s review the moving averages, Fibonacci level, and price patterns.
Price Charts and Technical Analysis
(Click on image to enlarge)

The Siemens daily chart is from a long-term picture still clearly in an uptrend. The 21 EMAs are above all of the long-term moving averages with lots of space in between them. That said, a bearish breakout could be a first signal of an upcoming reversal:
- If price action remains below the 21 ema zone as traders saw on the left side of the chart (purple box & arrow), then a bearish pullback or reversal is becoming more likely.
- A break below yesterday’s daily candle low confirms a pullback (orange circle).
- In that case, price action has probably completed the wave 5 (orange) of wave 3 (grey) and a wave 4 (grey) could emerge. Price is likely to move back towards the 144 ema.
- If price action goes back into the 21 ema zone or breaks above the 21 EMAs and the resistance trend line (orange) then a bullish trend continuation is expected (green arrows).
- The main targets are located $150, $155, and $168.
- The higher high should complete a wave 3 (grey) of wave 5 (pink).
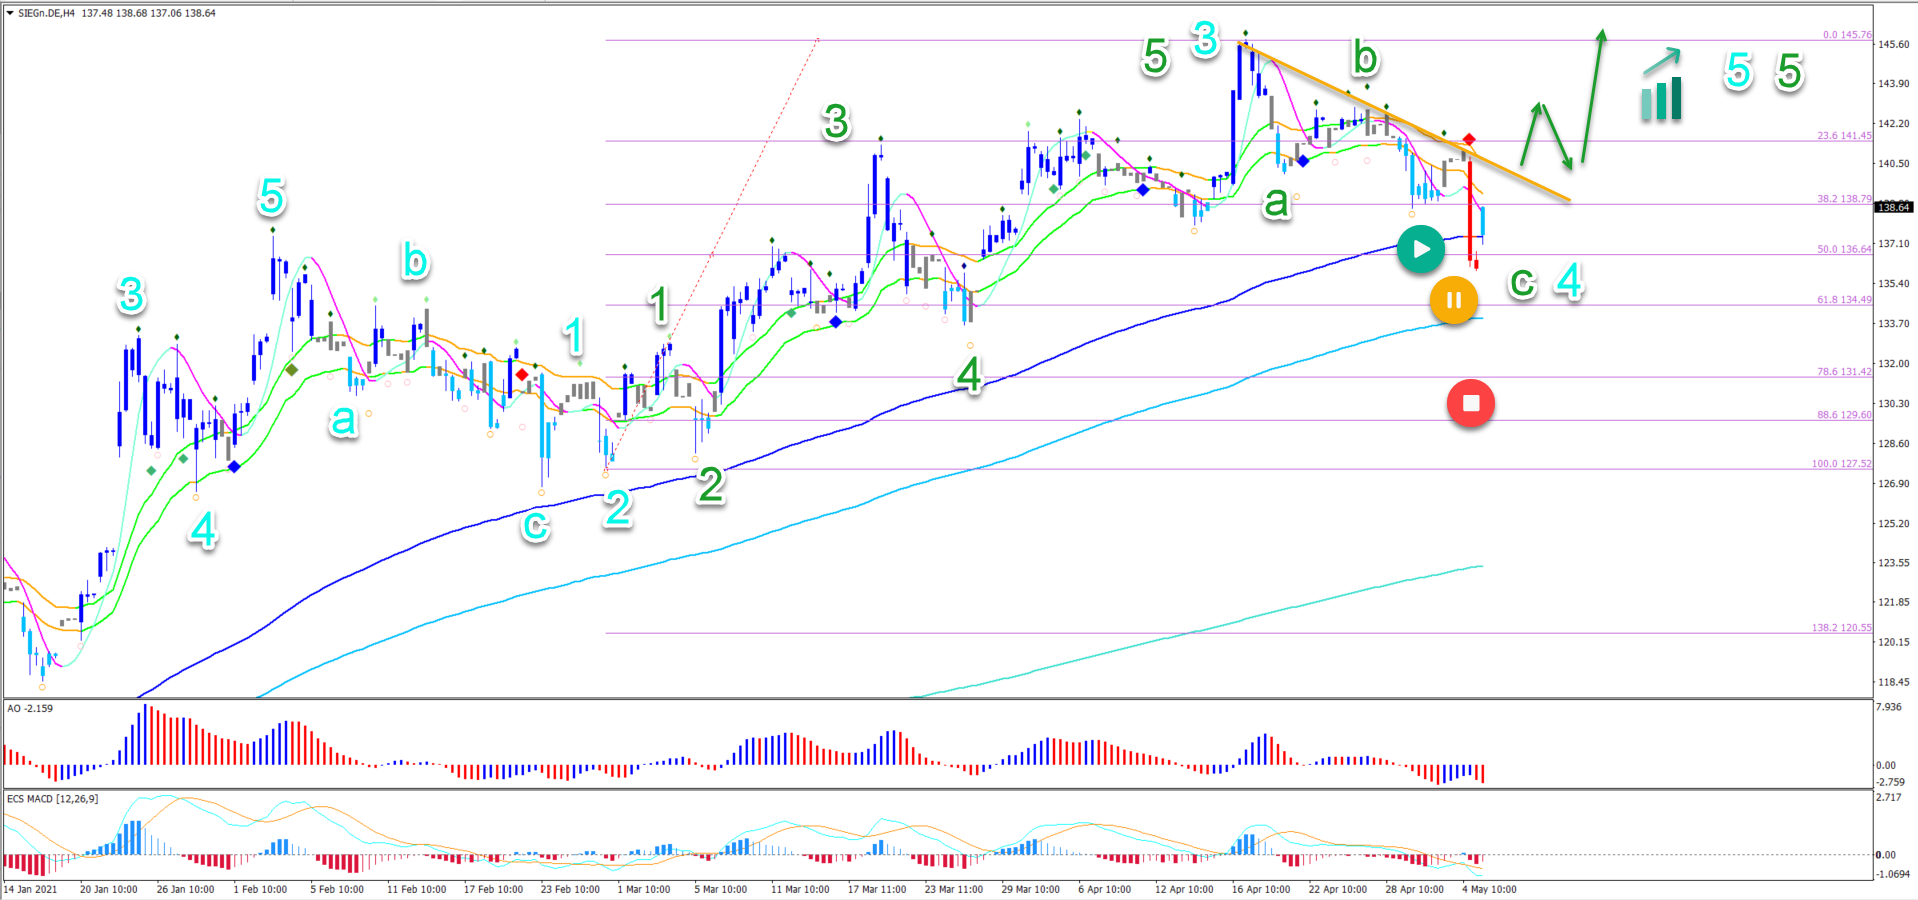
On the 4 hour chart, we can see that price action did complete a wave 4 (green) as mentioned in our previous Siemens analysis:
- After price action completed the wave 5 (green) in wave 3 (light blue), a bearish ABC pullback (green) seems to be taking place in wave 4 (light blue).
- Price action retraced strongly which created a first red SWAT candle. However, price action is still at the 50% Fibonacci retracement level, which is a key support zone.
- A bullish bounce and breakout above the resistance trend line (orange) and 21 EMAs could confirm the end of the wave 4 (light blue) and the start of the wave 5 (light blue).
- A break below the 50% Fib however places this bullish wave analysis in doubt (orange) circle) and a deep retracement invalidates it (red circle).
(Click on image to enlarge)
Disclaimer: The opinions in this article are for informational and educational purposes only and should not be construed as a recommendation to buy or sell the stocks mentioned or to solicit ...
more

