
Siemens Bullish Bounce After Bearish ABC Pattern Completed
The Siemens (SIE) stock price made a bearish pullback after failing to break the top. Price action made an ABC pattern rather than a full uptrend as our previous analysis expected.
The overall uptrend, however, remains valid. The bounce at the 38.2% Fibonacci level suggests an Elliott Wave 4 pattern.
Price Charts and Technical Analysis
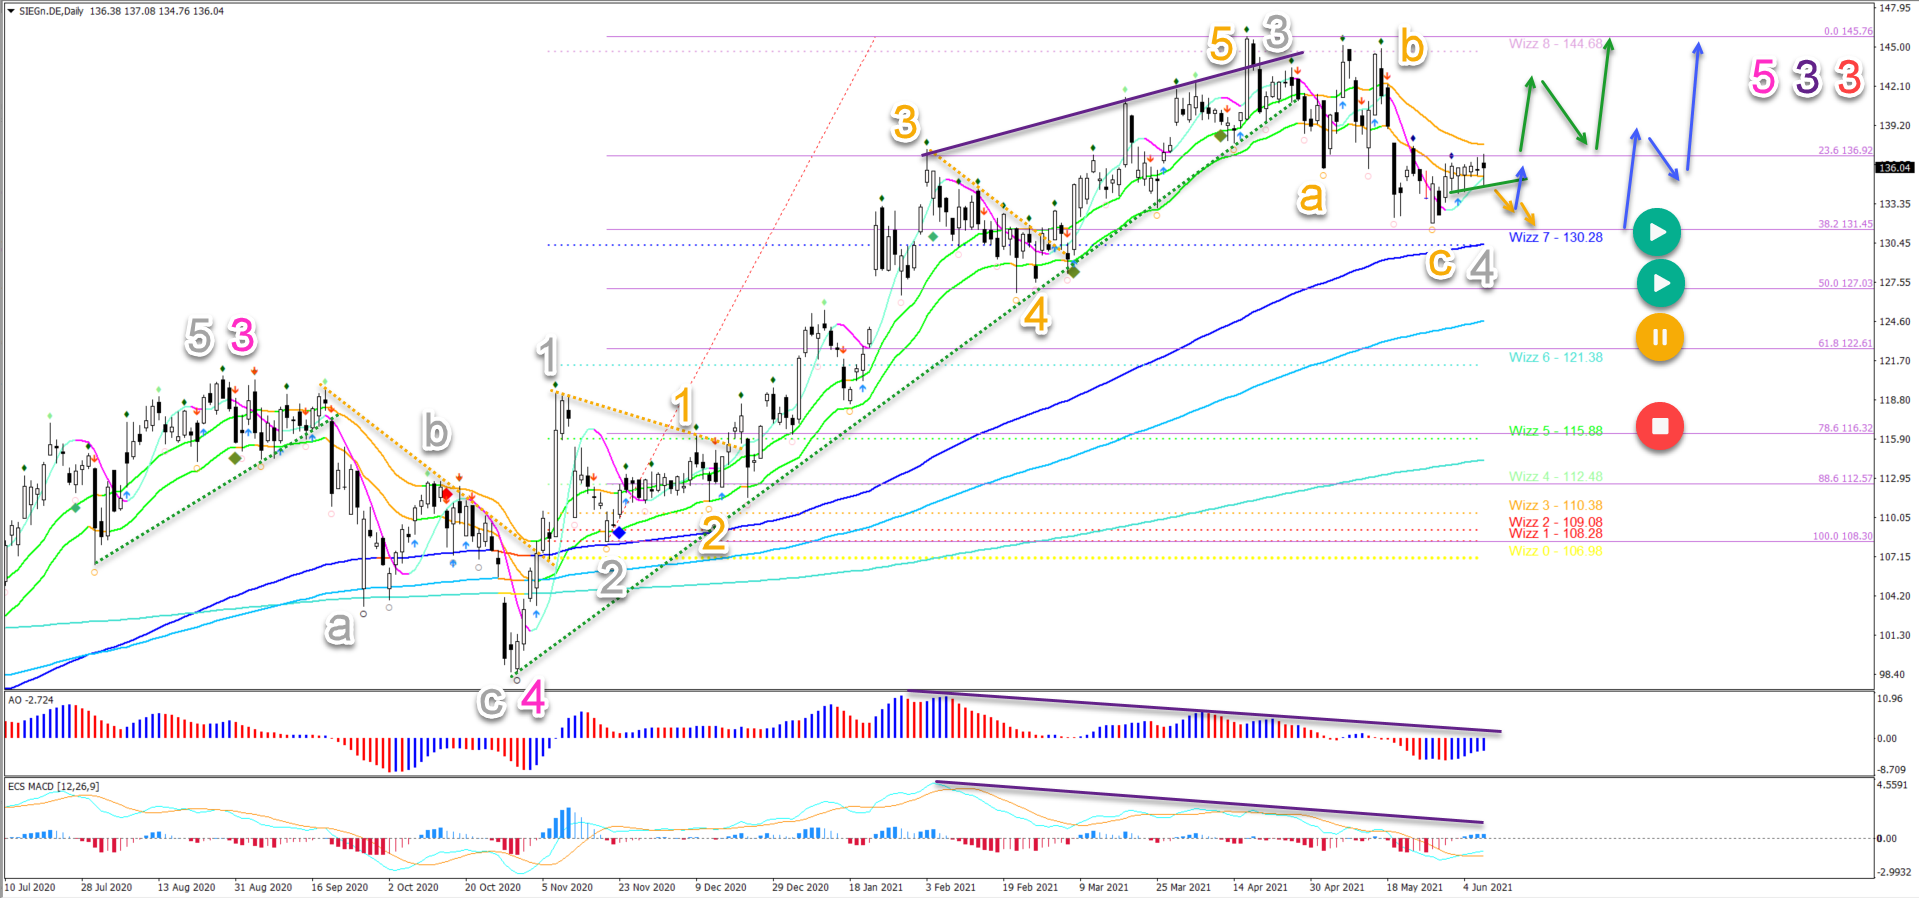
Siemens seems to have completed a bullish 5 waves (orange) in a wave 3 (grey) momentum:
- The current ABC pullback (orange) has probably completed a wave 4 (grey) at the 38.2% Fibonacci retracement level.
- The retracement in wave 4 is now a simple correction but it could expand into a longer ABC pattern as well.
- A bullish breakout (green arrows) above the 21 ema zone could indicate a retest of the previous top.
- A bearish breakout (orange arrows) below the support trend line (green) could indicate a retest of the bottom or 38.2% Fibonacci level.
- A bullish bounce is expected at the Fib level (blue arrows).
- Only a deeper retracement below the 50% Fib places this wave outlook on hold (orange circle) or invalidates it (red circle).
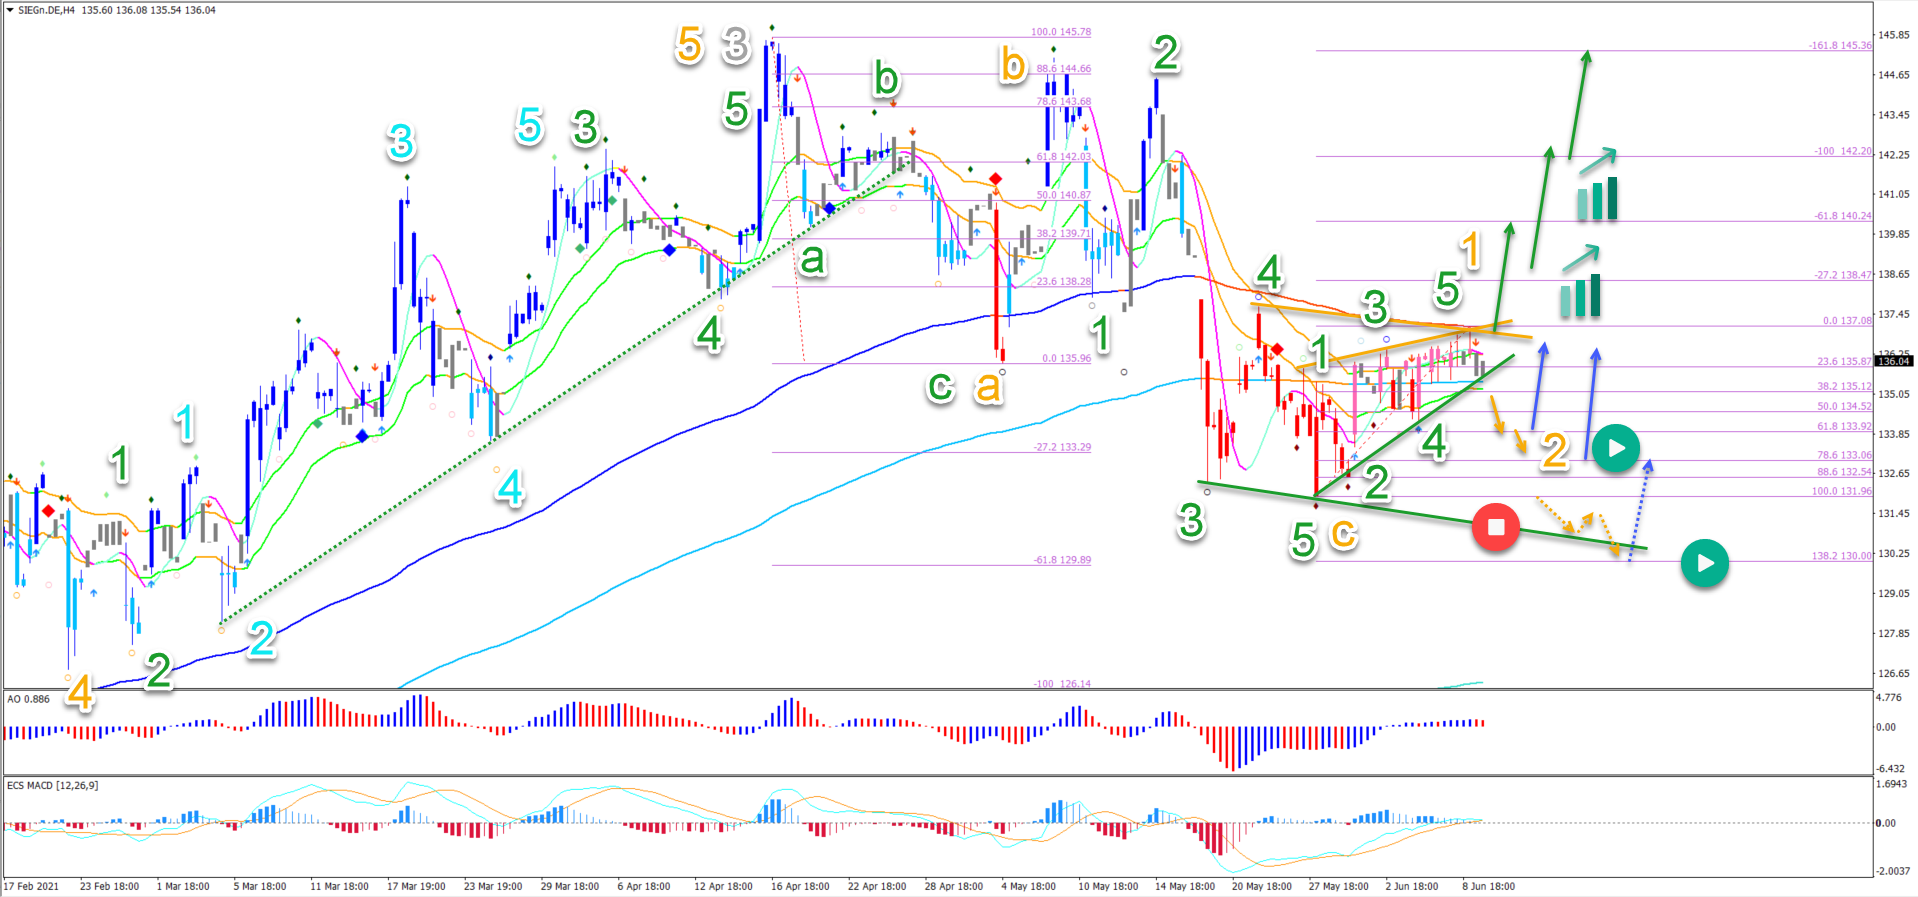
On the 4 hour chart, Siemens seems to have completed the 5 wave pattern (green) in the wave C (orange):
- A 5 wave leading diagonal (green) seems to be unfolding in wave 1 (orange).
- A bearish ABC pattern could develop in wave 2 (orange).
- The wave 2 is expected to bounce (blue arrows) at the Fibonacci levels.
- A break below (dotted orange arrows) the 100% Fibonacci level indicates (red circle) one more lower low. It invalidates the wave 1-2 (orange) pattern.
- But a bullish bounce is still expected at the Fibonacci levels around $140 (dotted blue arrow).
- A bullish breakout (green arrows) before the pullback occurs indicate an immediate uptrend.
Disclaimer: CFDs are complex instruments and come with a high risk of losing money rapidly due to leverage. On average around 80% of retail investor accounts loose money when trading with high ...
more
How did you like this article? Let us know so we can better customize your reading experience.

Comments
Leave a comment to automatically be entered into
our contest to win a free Echo Show.

