
For those of you who have been on Twitter for some time, you are aware this header image meme has been around for a while. We adapted it to embody the dilemma US managers are facing as we enter a world where the West continues to tighten policy (to slow consumption), while China and Japan keep the full pedal to the medal – easing monetary and fiscal policy – in an effort to dramatically increase consumption.
Chinese stocks seem to have bottomed in March and FAANG (Facebook, Amazon, Apple, Amazon, Netflix, and Google) have continued to weaken. Alibaba (China Tech Bellwether) is up over ~45% off its March lows. Managers are starting to take note.
Fox Business
On Monday, I joined Liz Claman on Fox Business – the Claman Countdown – to discuss opportunities in a down market. Thanks to Liz and Finley Walker for having me on.
Here were my “show notes”:
Here’s what stood out over the weekend:
US
– Earnings Recession concerns. So far, consensus estimates continue to CLIMB. Last week estimates climbed again to $230.52 (2022) and $251.76 (2023) – which means we are now trading at 14.59x next year’s earnings (with rates still relatively low 1.5% FFR). This is below the 5yr average of 18.6x – which includes the last tightening cycle.
-2009 Buffett: “Those who invest only when commentators are upbeat end up paying a heavy price for meaningless reassurance.”
-2016 Buffett: “As an investor widespread fear is your friend, because it serves up bargain purchases. Personal fear is your enemy.
–People anxious about picking BOTTOM: *IF YOU BOUGHT THE S&P 500 ON THE DAY LEHMAN WENT BANKRUPT SEPTEMBER 15, 2008 THE S&P 500 closed at 1,192.69. In the short term you felt pain because the S&P fell another 44% in coming months to 666 in March 2009. HOWEVER, Since then (even with the recent correction), you would have earned ~14% CAGR in an S&P index fund – including dividends (or ~2x the long term average). In other words, you doubled your money every 5.14 years versus the long-term average of every 9 years EVEN THOUGH YOU DIDN’T PICK THE PERFECT BOTTOM AND BOUGHT TOO EARLY.
-When high quality businesses go on sale, you have to take advantage for the long term, NOT PICK BOTTOMS.
HD – down 35% off highs. META – down 58% off highs. DIS – down 53.6% off highs. SBUX down 41.94% off highs. All generate CASH!
China
“The Ministry of Industry and Information Technology is studying measures to enhance the structure of supply-side policies, boost consumer demand and incentivize investments in technology, the newspaper said in a report Monday.”
While the rest of the world is aggressively tightening, China has been easing. The beleaguered China tech sector bottomed in March. Alibaba (a bellwether is up ~45% off the lows). Key drivers:
- loose monetary policy
- a partial lifting of virus curbs/lockdown
- bets that the era of tech crackdowns is over
- election in November incentivizes more stimulus
- rumors of Ant Financial IPO (pulling of IPO started crash, offering may drive recovery rally)
- Biden Says He and China’s Xi to Talk ‘Soon,’ Lift Tariffs on $300B of goods?
Europe:
European Central Bank President Christine Lagarde restated officials’ intention to raise interest rates by 25bps in July and also raise in September, signaling that concerns over financial-market tensions aren’t derailing the fight against inflation.
The ECB announced a new tool to tackle the risk of a fresh debt crisis in EU after Italian 10yr yield jumped above 4% last week on tightening fears. ECB will reinvest redemptions from its emergency bond-purchasing program (i.e. buy more bonds to stabilize yields)
*This means you have BOTH the Bank of Japan AND the ECB still in the market with some form of QE.
_________________________
On Wednesday, Fox Business Journalist and Producer Ellie Terrett asked me, “What will happen to stocks if the Fed keeps hiking to fight inflation?”
Here were my thoughts:
“The market has priced in most of the hikes at this point. The 2yr yield is at 3.06% (implies 2 more 75bps hikes – which we may not even get). My bet is 75, 50 then stop. Remember, the last time they did a 75bps hike was November 1994. By July 1995 they were cutting rates again. Market averaged 28.7%/yr compounded next 4 yrs. The second inflation starts to slow they will stop hiking. PPI is the leading indicator and it peaked in April. CPI will follow. PC DRAM also dropping along with shipping rates. Chips are 1/3 of inflation due to new/used car prices. Auto chips are beginning to flow again. That will help. China tariff reduction will help. Rig count back up to 740 last week (up from 244 pandemic lows). Approaching pre-pandemic level 792.
This is not the 1970’s again. Technology lowers costs. This is a short term bottleneck that is slowly working its way through. Mortgage rates doubled in 6 months. Demand will slow – just works on a 4-6mo lag. Not an on/off switch. Think of it like stopping a boat – there is a lag after you cut the power, not a hard stop like a car.”
Cheddar News
On Tuesday, I joined Kristen Scholer on Cheddar News – The Closing Bell – to discuss the Stock Market, Economy and what we’re doing to take advantage of the volatility. Thanks to Kristen, Ally Thompson and Talia Tirella for having me on:
Is inflation expected to get better?
- – ABOUT A THIRD OF US INFLATION IS AS A RESULT OF NEW AND USED CARS, ALL DUE TO THE SHORTAGE OF SEMICONDUCTORS.
- MS (Adam Jonas) Note: 1) the long-lasting global auto chip shortage is edging closer to resolution. 2) TSM (which accounts for ~50% of global auto MCU production) has seen significant improvements through 1Q with wafer foundry auto semi output up approximately 60% YoY.
- This should result in lower used vehicle prices since “Used vehicle prices are still up over 60% vs. 2 years ago and only 6% off of all time high. Recovering new car supply/inventory can be a release valve for unprecedented new and used car price inflation.”
OIL (will take time, BUT…):
- Oil is in BACKWARDATION: Cash $110.65, Dec ’23 $85.46, Dec ’24 $77.76
- Rig Count 740 vs. 244 pandemic low (792 pre-pandemic). Production coming back.
- Many Commodities Softening: Wheat, Cocoa, Lumber, Copper, Cotton, Soybean Meal, Gold, Palladium prices dropping in recent weeks and mos.
- $20-$30/bbl war premium goes away with any resolution.
Other Inflation Factors:
- Biden Admin may drop tariffs on China Imports.
- Backlog in cargo ships waiting to unload in Los Angeles and Long Beach, Calif., fell for the fourth straight month in May
- hourly earnings came in lower than expected NFP.
- Discounting on (categories) inventory build from companies like Target will be disinflationary.
- Retailers from WMT to Gap face a glut of inventory as shoppers skip categories that were popular during the pandemic. (Sweats and hoodies OUT, party dresses IN)
-PPI Producer Price index (showed some relief – leading indicator).
PC DRAM Contract Price (bellwether for semis) – down 14% from mid 2021.
Drewry Index (spot rate for shipping containers) – down 26% since Sept 2021.
North America’s fertilizer prices – down 24% from March (all-time high).
CGTN America
On Tuesday evening, I joined Phil Yin on CGTN America – Global Business – to discuss the Stock Market, Economy, Fed and China Tech. Thanks to Phil and Zeina Al Shaib for having me on.
Biotech
Last week we spent a lot of time going over our 3rd largest and newest position – an Auto-Parts supplier – to take advantage of the dramatic operating leverage embedded as semiconductors start to flow back to their clients (the OEMs). We’ve also spilled a ton of ink on our largest position Alibaba in recent weeks. But we haven’t covered our second largest position (Biotech) in a few weeks so I want to give an update as the thesis starts to play out. If you are new to our work, you can review our recent podcast|videocast‘s and weekly notes by clicking on the hyperlinks.
Besides historic low valuations – whether you look at Price/Sales, Price/Book, Price/Operating Cash Flow, Forward P/E, Percent trading at a discount to cash, etc., we outlined a few key catalysts that have now started to manifest in recent weeks.
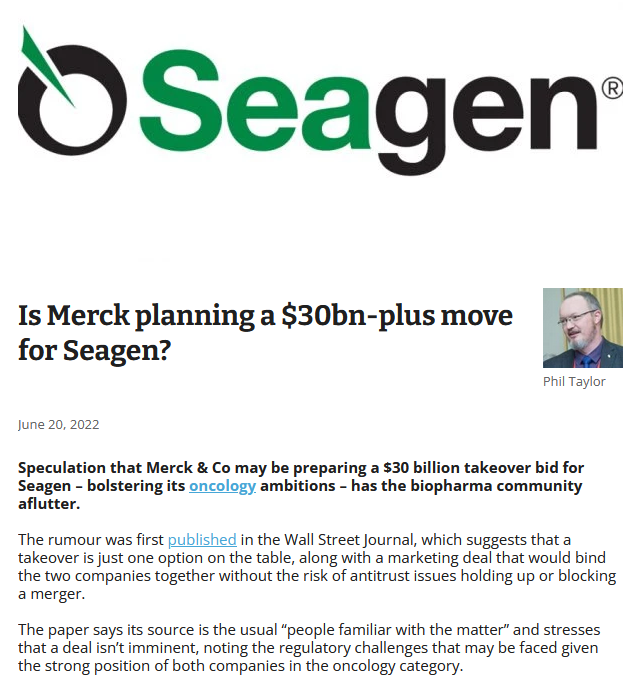
One key catalyst we defined was that “Big Pharma” has record cash on its balance sheet and a number of patent cliffs coming due. They will have to buy “innovation” to grow and once one of them makes a move, they will all get “fear of loss” and “animal spirits” will return to the sector. That catalyst started last month when Pfizer announced the purchase of Biohaven for $11B. It’s JUST THE BEGINNING. Here’s what has happened since, and what is on the horizon:
(Click on image to enlarge)
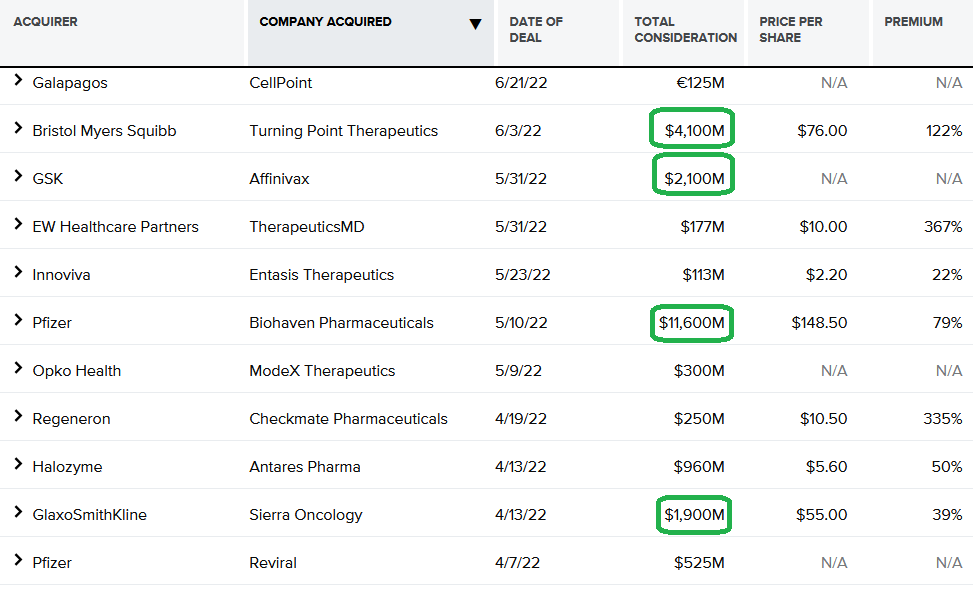
As a reminder, these are the catalysts we are looking to play out in coming months:
- Biotech is Idiosyncratic. Correlated with R&D results + M&A over rates/general indices. After (XBI) selling off 52% on hiking fears in 2015-early 2016, the sector rallied >131% during the tightening cycle from 2016-2018.
- Possibilities for R&D news catalysts to drive sector this year: Therapy results for Amyloidosis, Alzheimer’s, Lung Cancer, and Schizophrenia all on the horizon.
- Short Squeeze: Very high short interest across the sector will get crushed as more deals and drug results are announced in coming months. Today’s sellers will become tomorrow’s desperate buyers.
- Reverse Mergers: We’ve covered the high number of biotech components trading at a discount to cash. These will be fertile ground for M&A + reverse mergers (of private companies/drugs) to unlock value in “zombie (public) companies.”
- FDA shifting back to drug approval from COVID vaccine and anti-viral work. A multitude of clinical “holds” during covid are now back on track.
Now onto the shorter term view for the General Market:
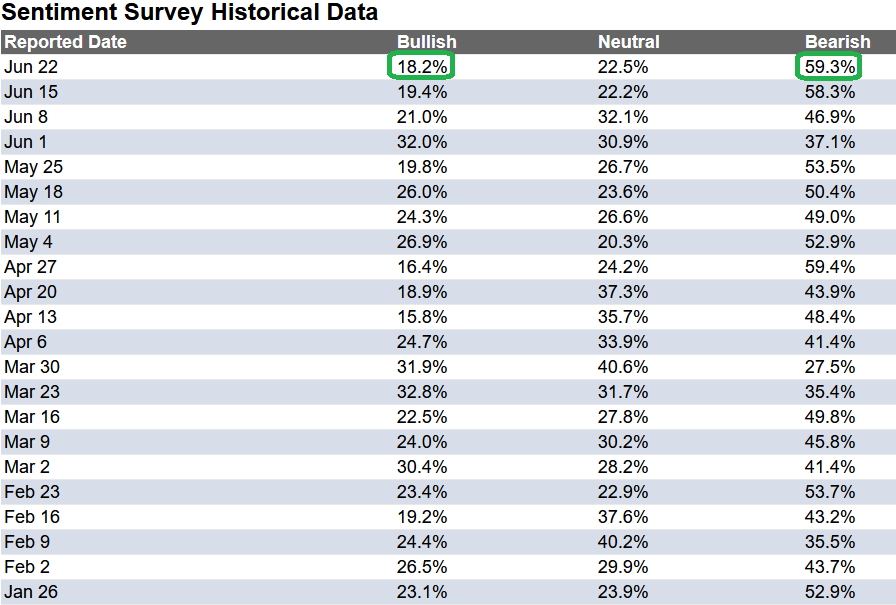
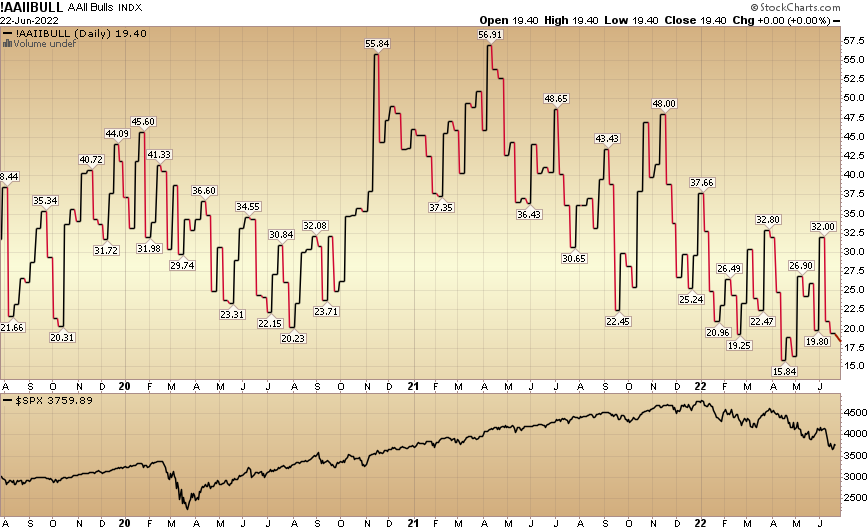
In this week’s AAII Sentiment Survey result, Bullish Percent (Video Explanation) ticked down to 18.2% this week from 19.4% last week. Bearish Percent moved up to 59.3% from 58.3%. Retail investors are extremely fearful.
(Click on image to enlarge)
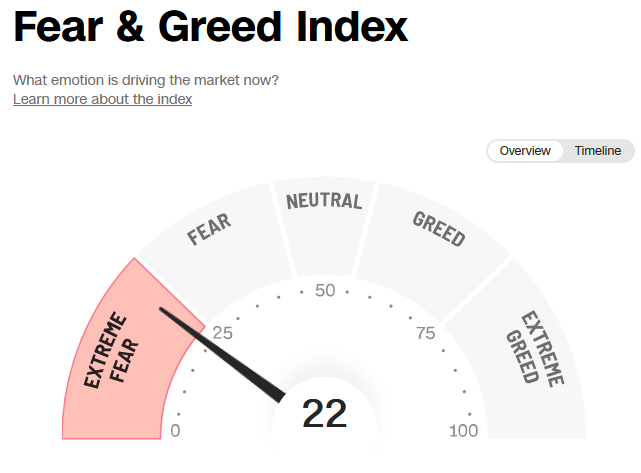
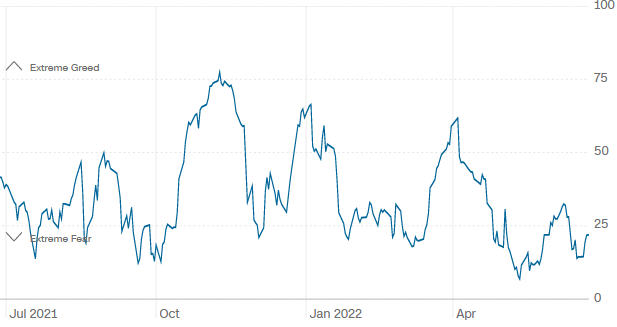
The CNN “Fear and Greed” ticked up from 18 last week to 22 this week. This still shows extreme fear. You can learn how this indicator is calculated and how it works here: (Video Explanation)
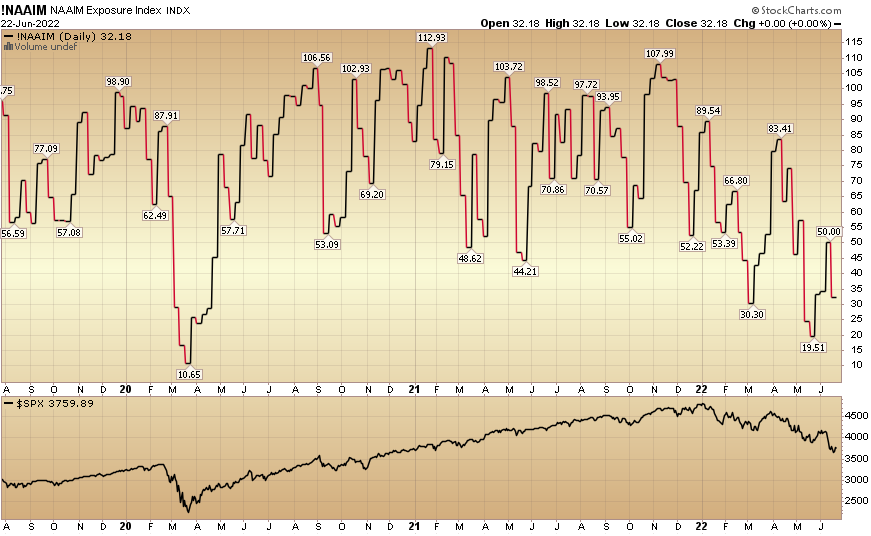
And finally, the NAAIM (National Association of Active Investment Managers Index) (Video Explanation) dropped to 32.18% this week from 50% equity exposure last week.
(Click on image to enlarge)
Our podcast|videocast will be out today. Each week, we have a segment called “Ask Me Anything (AMA)” where we answer questions sent in by our audience. If you have a question for this week’s episode, please send it in at the contact form here.

Comments
Log in or sign up to join the conversation.