
Short-Term Forecast For Friday, April 23
Stock Market Commentary
We are 5 sessions into the beta phase decline of the short-term cycle that began on March 4.
The magnitude and duration of the last beta phase rally reconfirm the current bullish short-term trend and forecast additional gains.
(Click on image to enlarge)
S&P 500 Index Daily Chart Analyses
The following technical and cycle analyses provide short-term forecasts for the S&P 500 index.
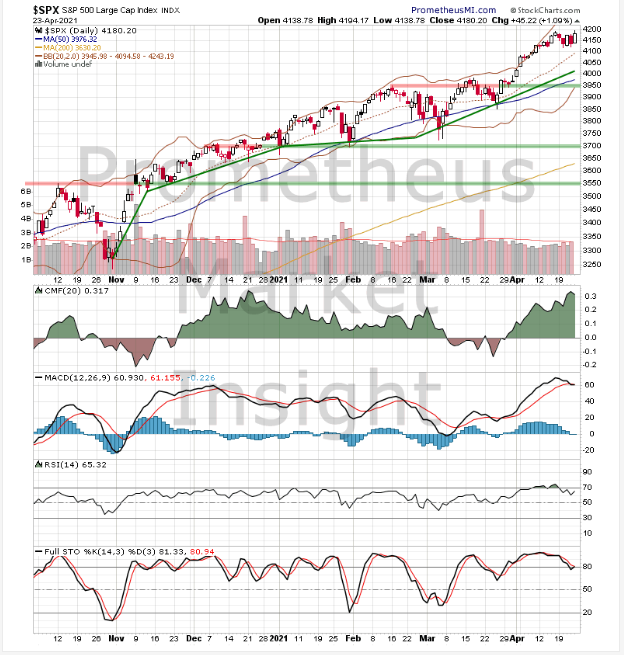
Technical Analysis
The index closed moderately higher today, moving up toward previous highs of the uptrend from 2020. Technical indicators are bullish overall, strongly favoring a continuation of the advance.
(Click on image to enlarge)'
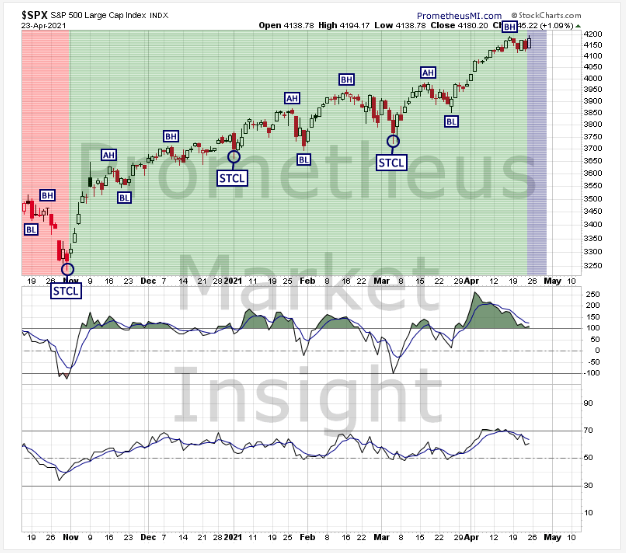
Cycle Analysis
We are 5 sessions into the beta phase decline of the of the cycle following the short-term cycle low (STCL) on March 4. The magnitude and duration of the last beta phase rally reconfirm the current bullish translation and forecast additional gains. The window during which the next STCL is likely to occur is now through May 5, with our best estimate being now through April 29.
- Last STCL: March 4, 2021
- Cycle Duration: 35 sessions
- Cycle Translation: Bullish
- Next STCL Window: Now through May 5; best estimate now through to April 29.
- Setup Status: No active setups.
- Trigger Status: No pending triggers.
- Signal Status: No active signals.
- Stop Level: None active.
(Click on image to enlarge)
Short-term Outlook
- Bullish Scenario: A close above the previous high at 4,185 would reconfirm the uptrend from March and forecast additional gains.
- Bearish Scenario: A close below the 50-day moving average at 3,976 would predict a return to congestion support in the 3,700 area.
The bullish scenario is more likely (~70 probable).


