
Seven-Chart Sunday: Feb. 27.2022

Photo by Nicholas Cappello on Unsplash
1) Wars and Fat Tails
Financial markets do not follow a bell curve. Instead, they operate in the world of fat tails, where extreme events are much more likely to occur than a normal (or Gaussian) distribution would predict.
We learned that once again this week as Russia invaded Ukraine, sending the MSCI Russia Index down 38% in a single trading day, its largest decline ever.
(Click on image to enlarge)

Powered by YCharts
This was a 17-sigma (standard-deviation) event, which according to statistical forecasting should never have happened even once in the history of the universe. But it did, and given enough time, it will happen again.
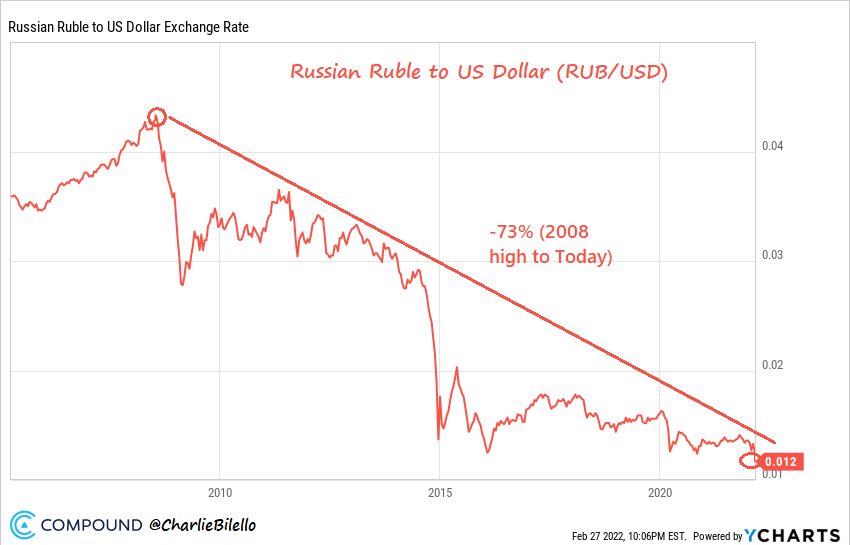
2) Ruble in Ruin
The Russian Ruble crashed on the news, hitting new all-time lows. Since its peak in 2008, the Ruble has now lost 73% of its value against the US Dollar.
(Click on image to enlarge)
Powered by YCharts
3) More Risk, Less Reward
The Russian equity ETF (RSX) debuted in April 2007, and has been twice as volatile as the S&P 500 since then.
Have investors been rewarded for this additional risk?
Not exactly.
The Russia ETF is down 38% since inception versus a 295% gain for the S&P 500.
(Click on image to enlarge)

Powered by YCharts
4) A Tidal Wave Sinks All Ships
Even the “Google of Russia”, Yandex (YNDX), wasn’t spared from the carnage.
The stock is now down 78% from its all-time high last November and is trading 46% below its IPO price from May 2011.
(Click on image to enlarge)

Powered by YCharts
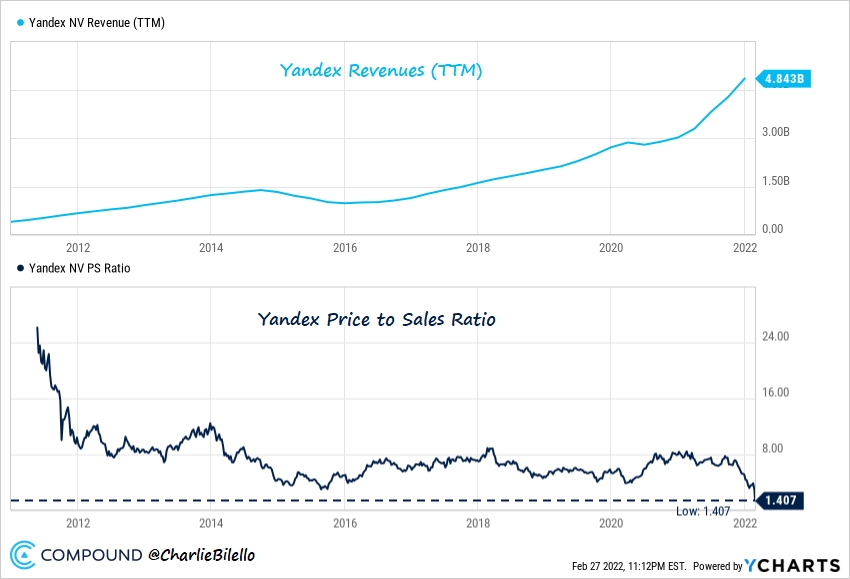
Yandex revenues have increased over 11x since its IPO, from $400 million to $4.8 billion.
So how is the stock down 46% over that time period?
The valuation multiple has collapsed. It now trades at a price to sales ratio of only 1.4x, down from over 20x at its IPO and 8x just a few months ago.
(Click on image to enlarge)
Powered by YCharts
5) Another Epic Reversal
While Russian stocks were crashing, US stocks initially sold off in sympathy, hitting a new correction low near the open on February 24th.
At -14.6% and 51 days, this was the largest drawdown for the S&P 500 since February/March 2020 and the longest since 2018.
(Click on image to enlarge)

But the declines on the 24th didn’t last, as the S&P 500 rose 4.2% from its low to finish the day in positive territory. This was one of the largest intra-day rallies for the S&P 500 in history, and it occurred exactly one month after a similar rally (+4.4% on January 24).
(Click on image to enlarge)

The S&P 500 would end the week in positive territory, up 0.8%, while the Nasdaq 100 closed up 1.2%.
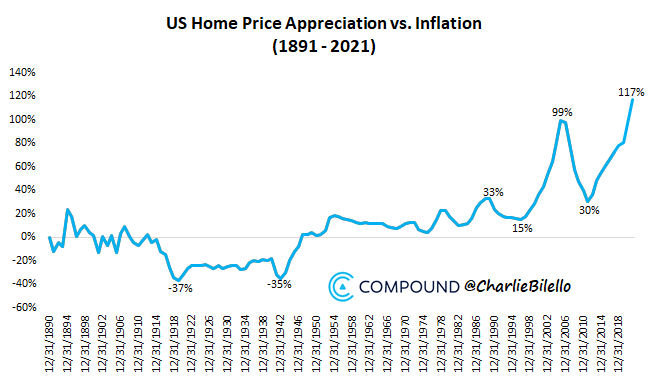
6) Housing Boom Continues
The final US home price data from 2021 is in, and what a year it was. The 19% increase was the largest since 1947.
(Click on image to enlarge)

Relative to inflation, US Home Prices have never been higher…
(Click on image to enlarge)
For the first time since 2005, all 20 cities in the Case-Shiller Index are at an all-time high.
(Click on image to enlarge)

Data via YCharts
7) Rate Hikes Still Expected
The volatility in the markets has not dampened the markets expectations for rate hikes very much at all.
While a 50 basis point (bps) initial move is now seen as a low probability event, Fed Funds Futures are still anticipating 25 bps hikes at the March, May, June and July FOMC meetings with 6 hikes in total by year end (to a range of 1.50%-1.75%).
Why are investors expecting rate hikes in spite of the weakness in the financial markets?
The glaring disconnect between Fed policy and inflation.
We received more data on that front this week with the PCE Price Index showing a 6.1% increase over the last year, the highest rate of inflation in 40 years. This compares to a historical average of 3.25% inflation since 1960.
Meanwhile, the Fed Funds Rate remains close to 0% versus its average over the same time period of 4.8%.
Lest the Fed lose all their remaining credibility, the rate hikes are coming.
(Click on image to enlarge)

Powered by YCharts
Disclaimer: All information provided is for educational purposes only and does not constitute investment, legal or tax advice, or an offer to buy or sell any security. For our full ...
more

