
Semiconductor Red Hot Performance Tests 20-Year Breakout Level
(Click on image to enlarge)
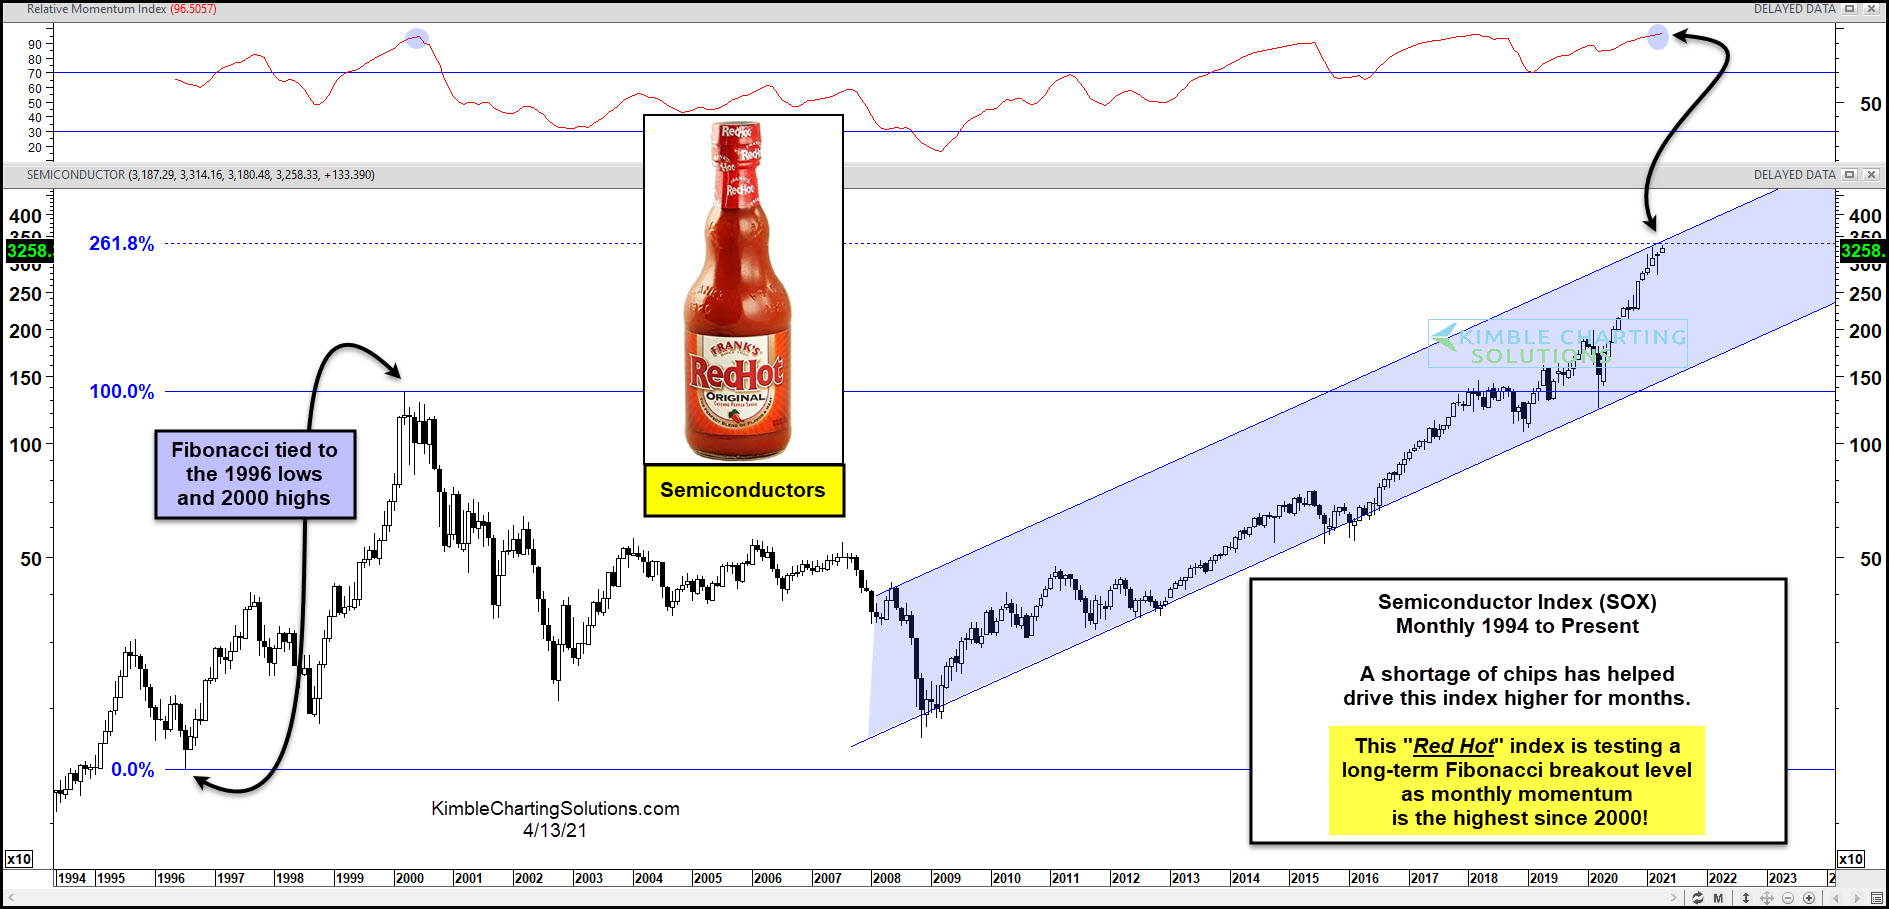
Will the “Red Hot” semiconductor index cool off or get even hotter due to the shortage of chips?
This chart looks at the Semiconductor Index on a monthly basis over the past quarter-century. No doubt the trend is up as it has created a series of higher lows and higher highs since 2009.
Fibonacci extension levels were applied to the 1996 lows and the 2000 highs. Currently, the index is testing the 261% extension level, while at the top of the rising channel as momentum is at the highest level since the 2000 highs.
The rare chip shortage could impact the production of many products. Will this rare long-term Fibonacci extension level impact the price of this index?
With the trend being up, a breakout by this key tech index would send a bullish message to the Nasdaq as well as the broad markets.
Keep a close eye on this index over the next 6-weeks, as it will send an important message to many markets!
Disclosure: Sign up for Chris's Kimble Charting Solutions' email alerts--click here.


At this point for investing, is this good or bad?