
Sector Views: Free Cash Is King
Quality has grown in importance as reduced demand expectations and lower consumer sentiment weigh on the macro outlook. The term ‘quality’ can either mean a healthy balance sheet, consistency in earnings growth, high cash levels, or a combination of all. We believe that cash flow and debt sustainability are likely to become increasingly important as real economic growth slows and credit access tightens.
Strong Cash Flows Provide Stability and Flexibility
Cash flow provides a link between a company’s income statement and its balance sheet. Profitability is important, but without positive operating cash flows, higher levels of financing will be required to support a company’s operations. Cash offers stability during periods of economic turmoil while providing flexibility to pay dividends or expand operations as opportunities appear.
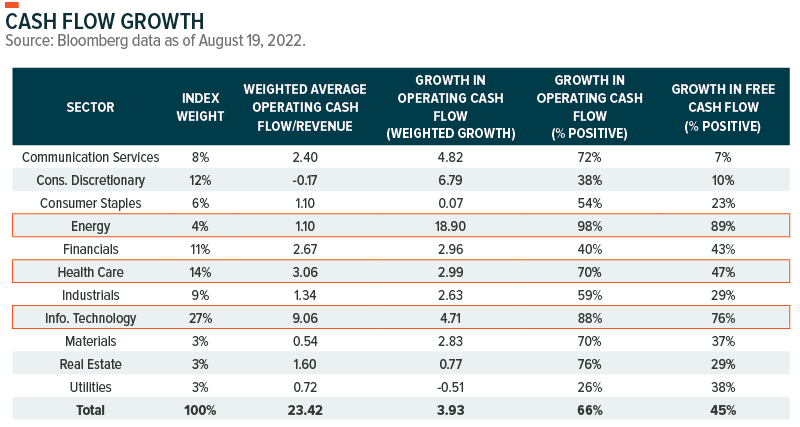
Focusing on the Russell 1000 Index (the Index), currently, around 96% of the Index has positive operating cash flows (OCF). The Information Technology (XLK), Health Care (XLV), and Financials (XLF) sectors currently have the highest conversion of revenue into cash.
Taking this one step further, growth in OCF provides useful insights, particularly in an inflationary environment. On a weighted basis, OCF growth, which measures the most recent OCF relative to OCF one year ago, has been positive for about 66% of the Index. The Information Technology, and Health Care sectors show some of the highest levels of OCF growth. On the flip side, the sectors that show the largest hit to their OCF are Utilities (XLU), Consumer Discretionary (XLY), and Consumer Staples (XLP). Certain sectors are limited to how much of their rising costs they can pass through to the end consumer. Although the Utilities sector provides an inelastic good (you can’t easily substitute where you obtain your water or electricity from), it is highly regulated. This stops companies in this sector from passing down all their higher costs to the end consumer, eating into their cash flow. On the other hand, the Consumer sectors, Discretionary and Staples, provide overly elastic goods. This creates competition, along with margin pressure. They are also labor-intensive sectors, so as labor costs go up, these sectors acutely feel the impact on their bottom lines.
On a short-term basis, companies can curtail capital expenditure (CAPEX) to conserve cash. However, CAPEX has the potential to increase productivity and is essential to longer-term growth. Companies that decide to conserve on CAPEX can increase their free cash flow (FCF). This provides them with a cushion that can help offset higher costs and the potential to increase their dividend. As reflected in the table below, only around 45% of the Russell 1000 Index provides positive FCF growth.
The level of CAPEX investment is dependent on sector and industry as some sectors are fundamentally more CAPEX heavy than others, such as Energy (XLE) and Industrials(XLI). Like OCF growth, the sectors with the largest levels of FCF growth are Energy and Information Technology, whereas the Communication Services (XLC), Consumer Discretionary, and Consumer Staples sectors have the lowest levels of FCF growth. Looking deeper into the Communication Services sector, the industry with the largest difference between its OCF and FCF is Interactive Media and Services, which encompasses social media and internet giants.
Debt Sustainability through Interest Coverage
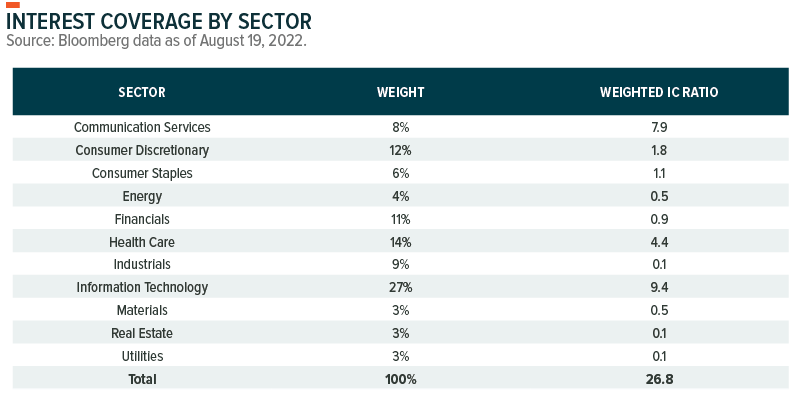
CFO and FCF only paint half the picture of what can explain a quality company. The other side would be a level of sustainable debt and the ability to pay it in a timely manner. One way to measure this would be to look at company Interest Coverage Ratios (IC Ratio). The IC Ratio is a company’s EBIT over Interest Expense. A higher ratio is preferred and a growing EBIT or a lower interest expense would improve this ratio.
This data point fundamentally favors mega caps that have the earnings to support their interest expenses. It also excludes any company that doesn’t have serviceable debt. Looking at the entire index, the Information Technology, Communication Services, and Health Care sectors have the strongest ability to service their debt.
Putting it All Together
After looking at OCF, FCF, and Interest Coverage, the same sectors tend to come up that continuously meet the criteria that are commonly referred to as ‘quality.’ Looking past the Energy sector’s exceptional year, the Information Technology and Health Care sectors show the highest levels of OCF Growth and FCF Growth. They are also the same sectors, along with Communication Services, that show the best potential to pay their debt.
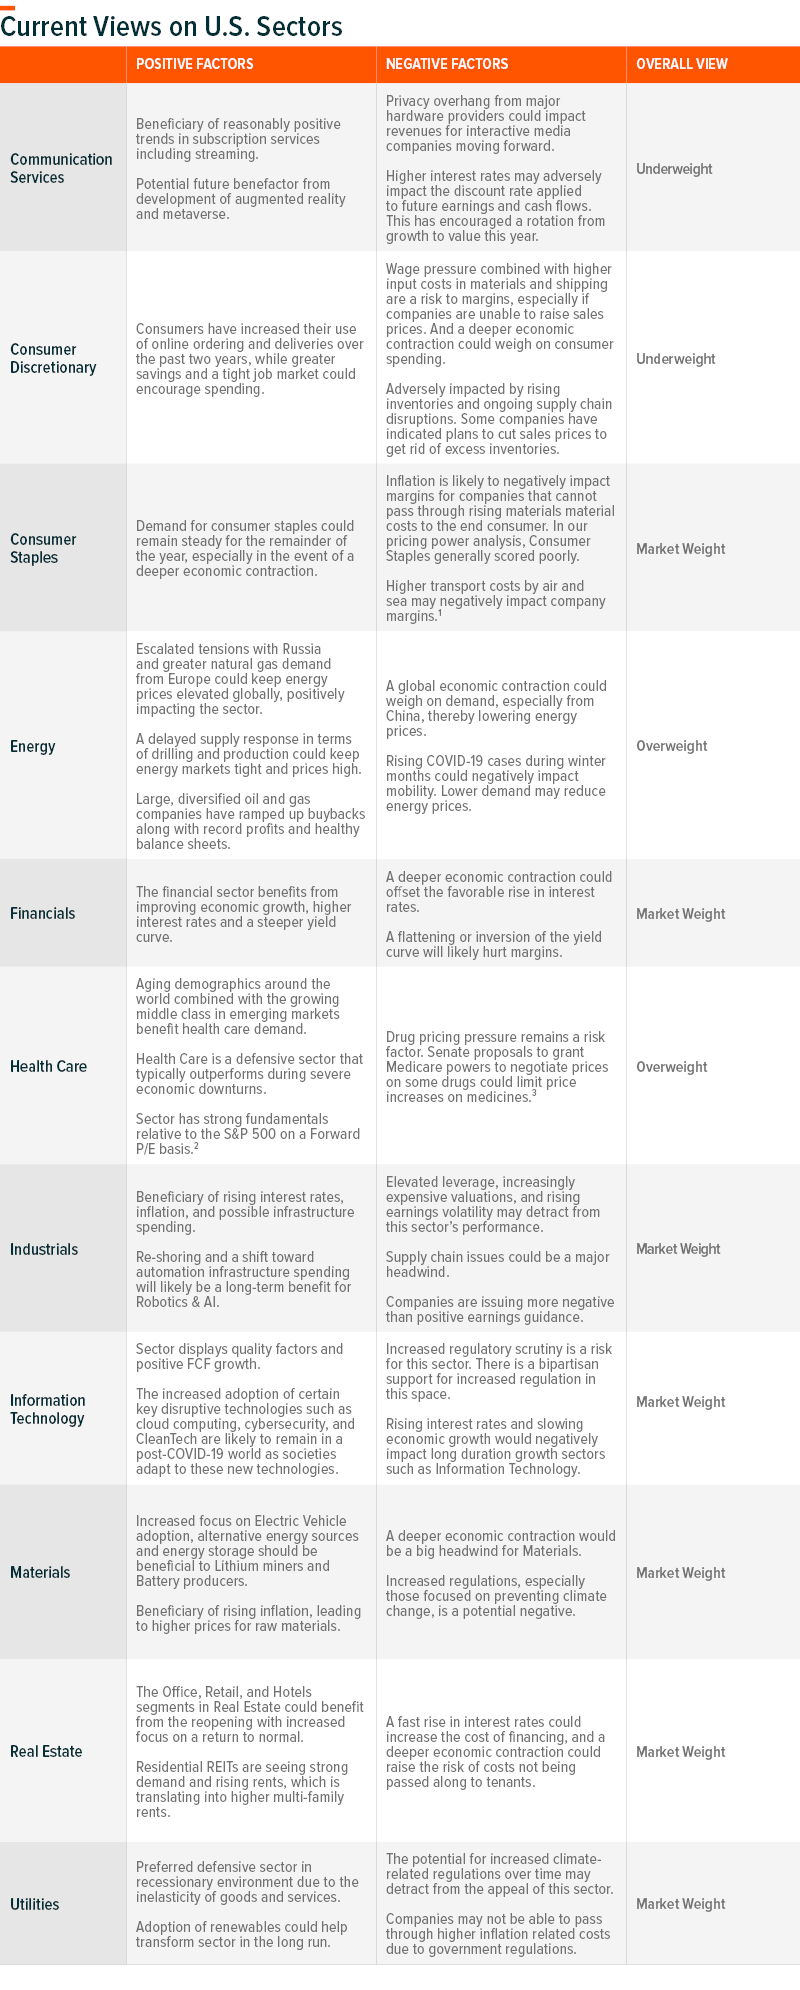
One drawback when looking just at OCF and FCF growth is that they are based on past performance, while equity valuations are forward-looking. Our overall views on the equity sectors extend beyond FCF and OCF growth and consider other macro-related variables.
Our sector views table below provides more detail on sector positioning and the current tailwinds and headwinds for each sector.
Footnotes
1. FactSet, Earnings Insight, 10/22/2021
2. BofA, When Alternatives Go Mainstream RIC Report, August 9, 2022
3. CNBC, ‘Once-in-a-generation’ Prescription Drug Pricing Reform Could be Coming, 7/29/2022
Glossary
Basis point (bps): A basis point is a hundredth of one percent. It is predominantly used to express differences in interest rates.
Capital Expenditures (Capex): Funds used by a company to acquire, update, and maintain physical assets such as buildings, technology, and equipment; often used to undertake new investments/projects.
FOMC: Federal Open Market Committee
Russell 1000 Index: The large-cap market index consists of the largest 1,000 markets in the Russell 3000 Index.
S&P 500 Total Return Index: The index includes 500 leading U.S. companies and captures approximately 80% coverage of available market capitalization.
This material represents an assessment of the market environment at a specific point in time and is not intended to be a forecast of future events, or a guarantee of future results. This information is not intended to be individual or personalized investment or tax advice and should not be used for trading purposes. Please consult a financial advisor or tax professional for more information regarding your investment and/or tax situation.
Global X Management Company LLC serves as an advisor to the Global X Funds.
More By This Author:
Investment Strategy Monthly Insights, August 2022
An Investor’s Guide to Smart Contract Blockchains
What Is Europe Going To Do This Winter With Less Gas?
Disclaimer: Investing involves risk, including the possible loss of principal. International investments may involve risk of capital loss from unfavorable fluctuation in currency values, from ...
more

