
The S&P 500 Index is on pace to finish 2021 with strong performance, up 22.39% so far in 2021. This year follows strong returns in 2019 and 2020, up 31.49% and 18.40%, respectively.
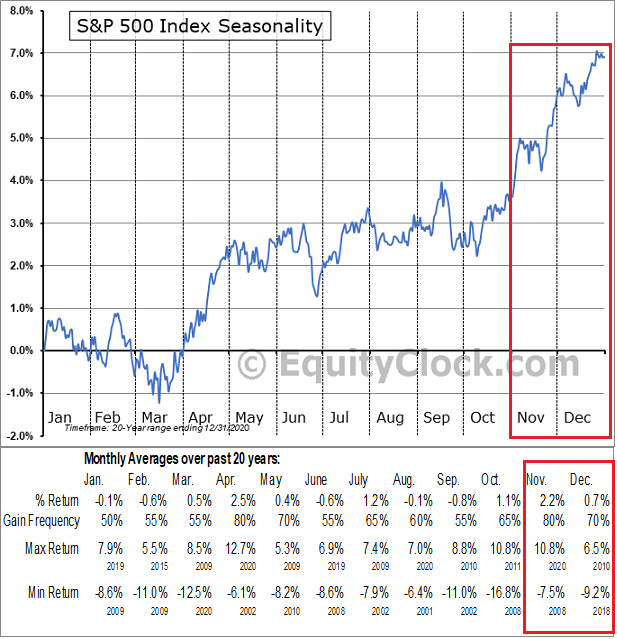
Last year's return seemed to surprise many investors as the economy was able to shake off the pandemic-induced recession in a short period of time. As 2021 nears an end, the market has entered a seasonally strong period for returns. As the below chart shows, the later half of October through December are historically strong periods for the S&P 500 Index.
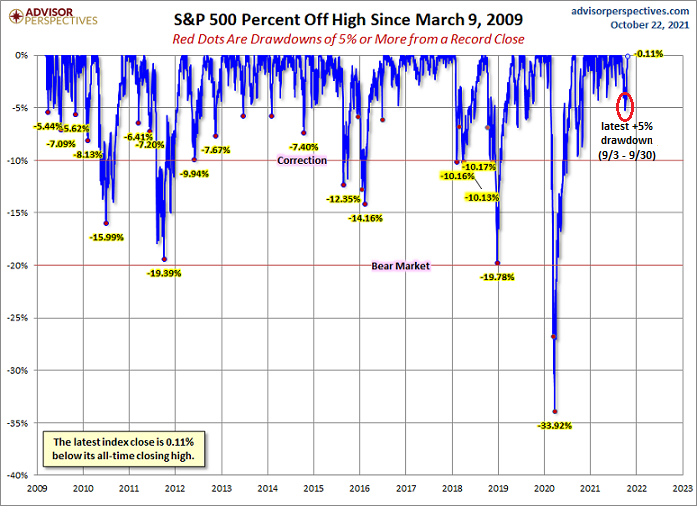
The S&P's resilience is evident by just one pullback of over 5% this year. In fact, the drawdown was 5.12% from the market's high in early September to the end of September. Since 1980, the average intra-year market drop is 14.3%.
One characteristic of the market's mid-summer return is investors rotating from outperforming stocks into underperforming ones. I noted this in a post from July. In that article, I noted the average stock return in three main equity indexes, S&P 500 Index, S&P 400 Mid-Cap Index, and the S&P 600 Small-Cap Index, had declined 9.1% to -18.4%. In other words, an equity correction was occurring under the surface of the market.
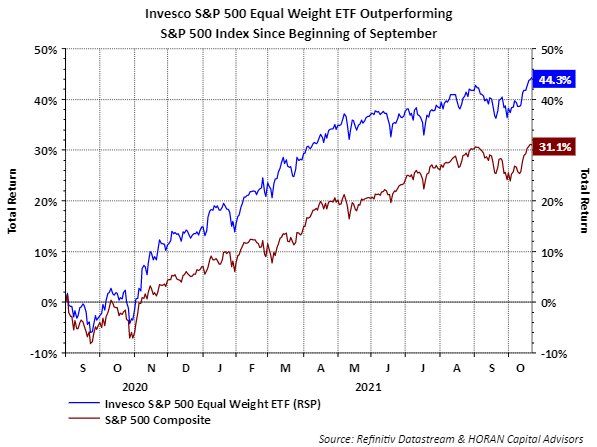
One area of the market experiencing weakness has been the mega-cap stocks, which is evident by the stronger market returns in the equal weighted S&P 500 Index (RSP). The below chart shows that since the beginning of September of last year, the equal weighted index has been significantly outperforming the capitalization weighted S&P 500 Index.
Although, through the recent summer period of June through August, the mega-cap stocks did outperform. Since August though, the equal weighted S&P 500 Index has again been outperforming the cap weighted S&P 500 Index.
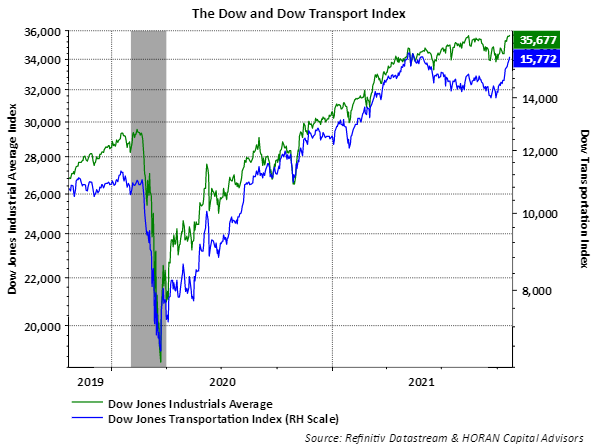
At the same time that the mega-caps began outperforming during this past summer, the transport sector was seeing weakness as well. Weakness in transports can be a precursor to broader market weakness and transports play a part of The Dow Theory. The recent rebound in transports is a positive factor for further market gains, as discussed in a recent Forbes article.
Lastly, all is not necessarily bullish for the market. Some technical bullish momentum indicators are flashing cautionary signals. A weekend article highlights the momentum issue.
Worth noting though is the fact the momentum weakness can be a short-term factor. The article itself notes, "It's also noteworthy that we have just entered historically the worst week of the year (October 21st close to October 27th close). Now here's the silver lining. November is a very strong month for U.S. equities, so if we do pull back next week, it could set up absolutely terrific trading opportunities."
Clearly, the market has easily recovered from the +5% September pullback, so some market consolidation would not be a surprise. Fundamentally, as earnings season is in full swing, third quarter reports have been strong.
Out of the 117 companies having reported Q3 results, 83.8% reported earnings above analyst expectations versus the long-term average of 65.8%. Company reported revenue results have exceeded the long-term average, as well.
In the end, the market is in a favorable seasonal period and companies are performing well financially. This is a favorable backdrop that should support decent market returns into year-end.

Comments
Log in or sign up to join the conversation.