
Oil stocks used to be an easy investment choice due to a booming world population and the globalized economy’s hunger for fossil fuels.

Today, the oil and gas industry is much less stable. Recent surplus of crude oil and natural gas, as well as irregular demand patterns, have made the energy sector lag behind the broader stock market.
The industry was hit hard by the oil price plunges in 2014 and 2020. On top of that, renewable energy is becoming cheaper and more prevalent, and governments are urging businesses to cut carbon emissions. Even Goldman Sachs, an oil-optimistic bank, has had to downgrade its oil price forecasts because of rising global supplies and falling demand.
Might the upcoming summer take further heat out of oil prices?
West Texas Intermediate (WTI) hasn’t demonstrated its strongest performance during the summer months. This seasonal slumber, stretching from July 1 to August 22, has occurred consistently over the past ten years, with an average drop of 7.85%. The red bar chart located below underscores the years when WTI suffered losses, almost as if it’s taking its own summer hiatus.
Seasonal Chart of WTI Crude Oil over the past 10 years
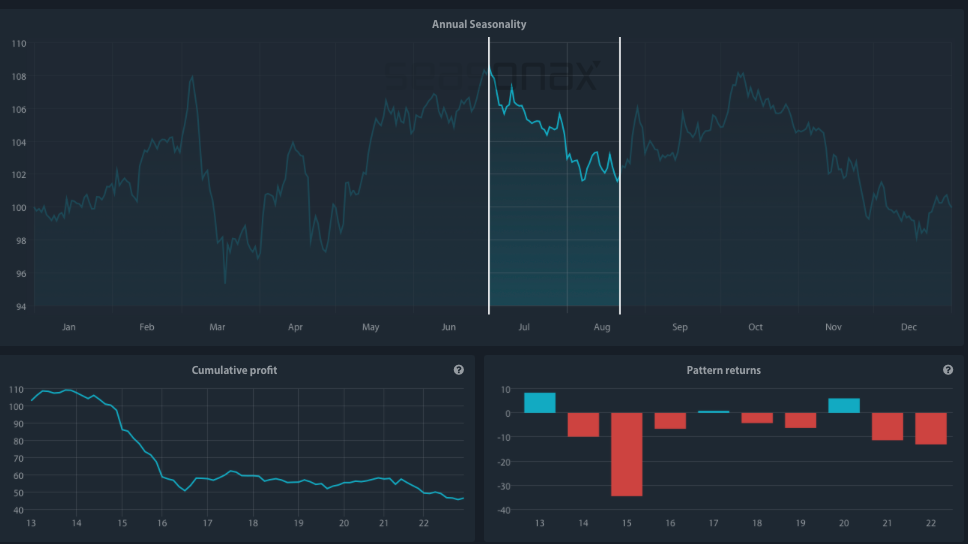
Source: Seasonax
There are many factors that might be fueling this “summer weakness”. One of the most significant ones is the substantial reduction of demand for heating oil during the summer months. With the warmer weather, households and businesses alike switch off their heating systems, leading to a dip in oil demand.
The Driving Season Paradox
While summer signals the start of the driving season around the world, with holidaymakers taking road trips and boosting gasoline demand, it can also have a confusing impact on oil companies. It’s a classic scenario of ‘buy the rumor, sell the news.’ Investors typically expect this demand increase, leading to a rise in oil prices even before the summer season kicks off.
Once the season is in full swing and anticipated demand meets reality, there’s often a selloff, causing prices to drop. This downward pressure on prices during the summer can lead to a relative weakness in oil company performance.
Let’s take a look at ExxonMobil (XOM), one of the largest publicly traded oil and gas companies in the world, and a prime exemplar of an integrated major. Headquartered in Irving, Texas, the company is involved in a broad spectrum of activities spanning the entire oil and gas industry, including exploration, production, refining, and marketing.
This “Big Oil” exhibits a weak seasonal period that usually starts at June 8 and lasts until September 24. Over the past decade during this time span Exxon has a marked notable average loss of 9.6%.
Moreover, it’s important to remember that the markets are unpredictable, and past performance is not a guarantee of future trend recurrence.
Seasonal Chart of Exxon Mobil Corporation over the past 10 years
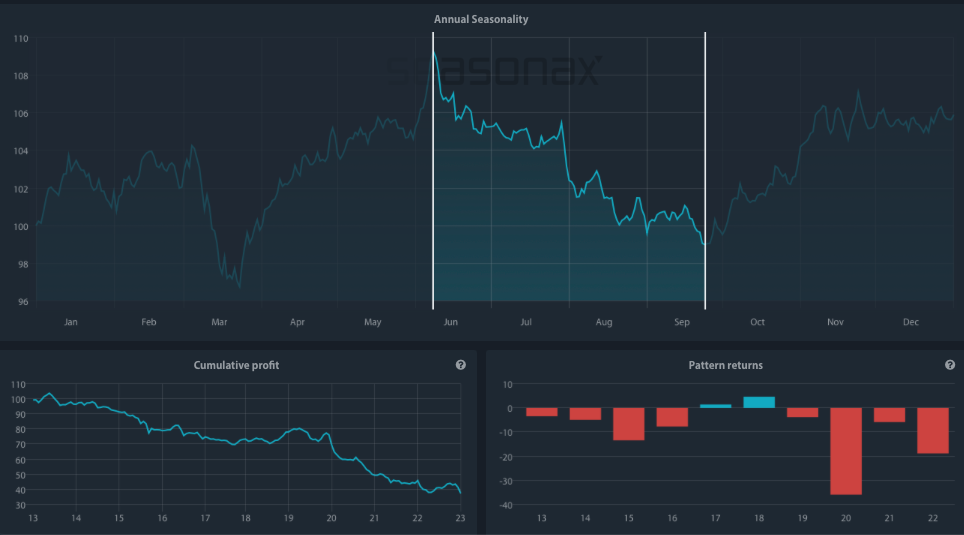
Source: Seasonax.
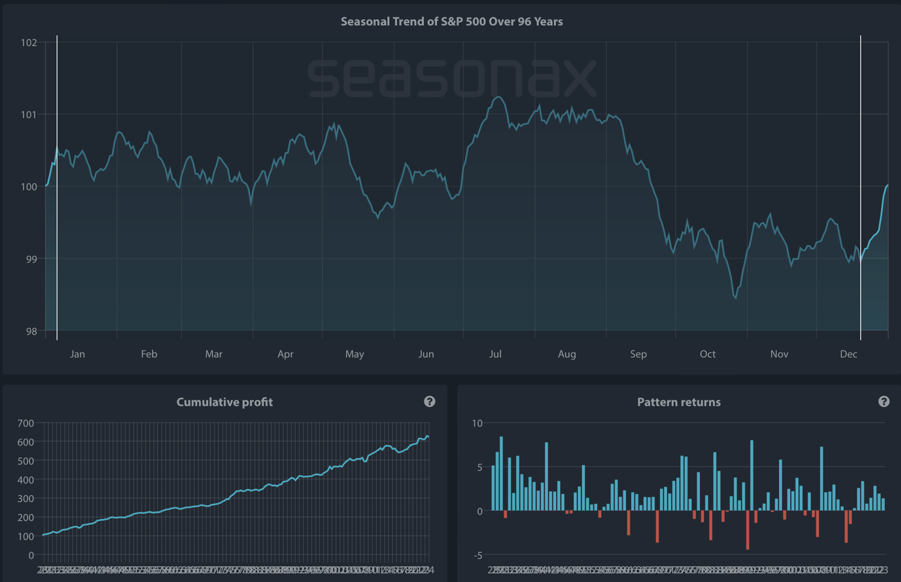
Keep in mind that a seasonal chart depicts the average price pattern of a specific asset in the course of a calendar year, calculated over several years (unlike a standard price chart that simply shows prices over a specific time period). The horizontal axis depicts the time of the year, while the vertical axis shows the % change in the price (indexed to 100). The prices reflect end of day prices and do not include daily price fluctuations.
It is also crucial to understand that while seasonality can be a factor, it’s not the only one. Other variables such as broader macroeconomic factors and market sentiment play a crucial role in influencing the seasonal trends in oil companies.
The summer months often coincide with the end of the second fiscal quarter, a period when companies report earnings. In uncertain or negative broader economic environments, these earnings reports can lead to decreased investor confidence, leading to selloffs in the market and decreased oil prices.
One of the companies whose earnings reports are due on August 3 is ConocoPhillips (COP). It’s one of the world’s largest independent exploration and production (E&P) companies, focusing solely on this sector after spinning off its downstream and midstream operations into a separate publicly traded company, Phillips 66, in 2012. Exploration and production companies are highly vulnerable to swings in oil prices and this one particularly also to the summer weakness.
Seasonal Chart of ConocoPhillips over the past 10 years
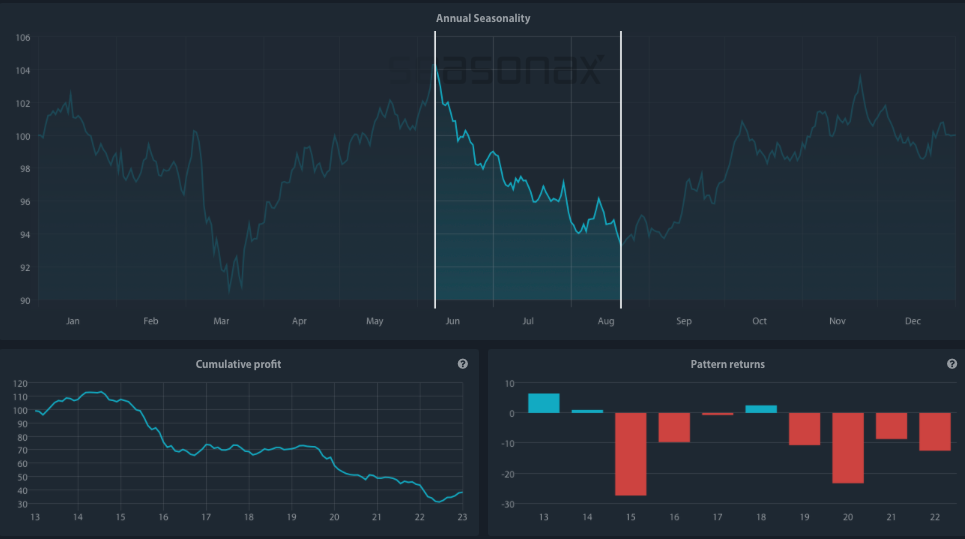
Source: Seasonax.
Looking at the seasonal chart above, over the past 10 years the time period from June 8 until August 21 has not been that favorable. In the short time span of 53 trading days, shares of this giant fell on average by almost 9%. Additionally, the pattern returns have recorded a 70% loss streak since 2013, piquing the interest of potential short sellers.
Even though the summer season typically brings about leisure and pleasure, it often ushers in a period of volatility and reduced profits for the oil industry.
Factors such as consumer habits, worldwide supply fluctuations, and key economic indicators contribute to this seasonal downturn.
More By This Author:
“Wining And Dining” On The Stock Exchange“Sell In May Effect”: Uncovering Investment Opportunities During Seasonal Weakness
How Often Does The Christmas Rally Bring You Presents?

Comments
Log in or sign up to join the conversation.