
Saturday: The Longer-Term Trend
The long-term outlook continues to favor higher stock prices.
The chart below shows that the market internals and moving averages are confirming.
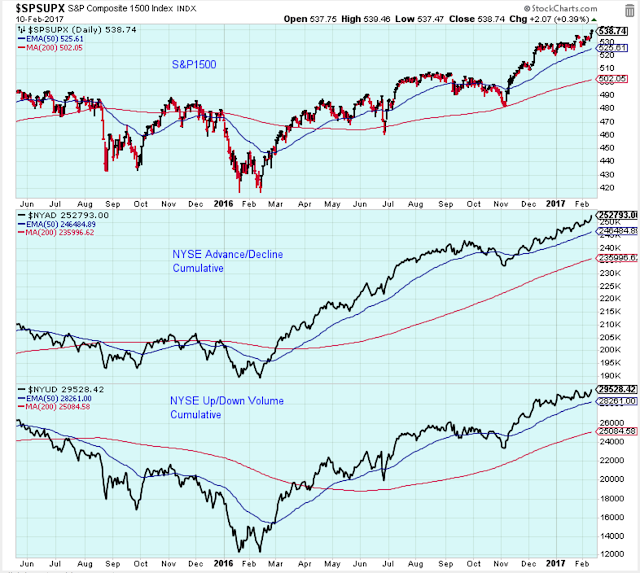
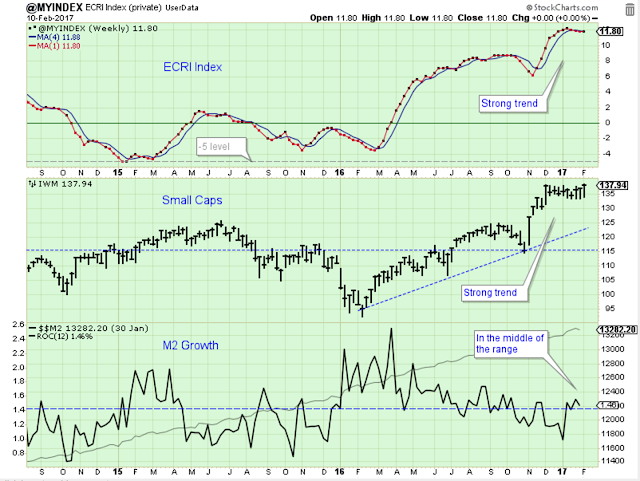
The ECRI index, small caps and M2 growth all look healthy and favor higher prices.
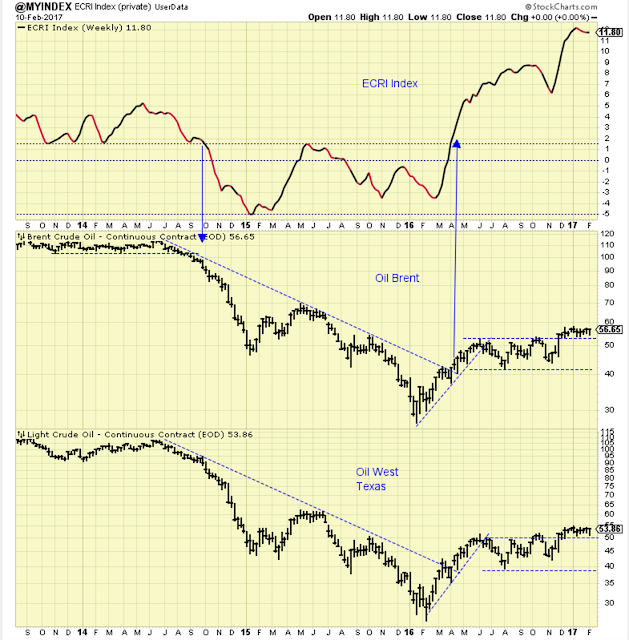
Oil prices are looking like they may tick a bit higher, but prices continue to be stable and well within the range where they help the market by being not too hot and not too cold. The level and stability of oil prices favor higher stock prices.
The Dow indexes are confirming and favor higher stock prices.

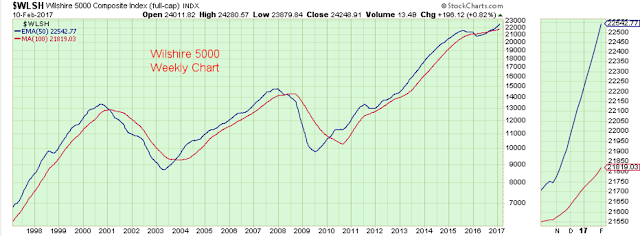
The long-term moving averages show the market in an uptrend after a brief downtrend late 2015 to mid 2016. A false signal maybe? If it is, it is only one in twenty years. This chart favors higher stock prices.
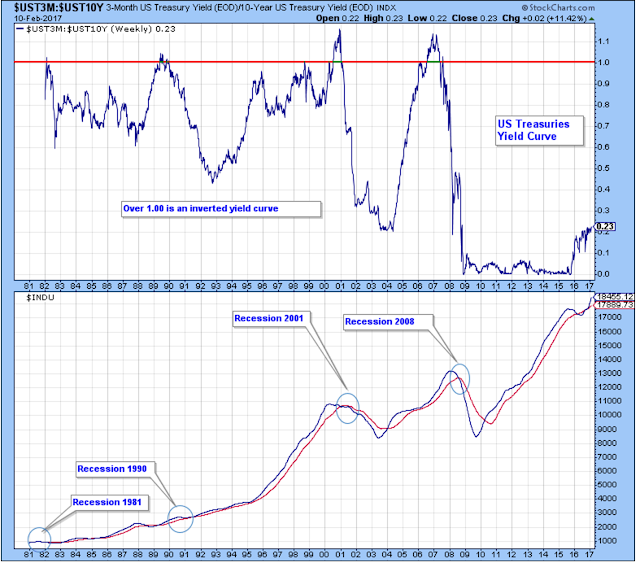
The yield curve looks favorable, but zero interest rates for so many years makes this chart questionable.
The Short-Term Trend
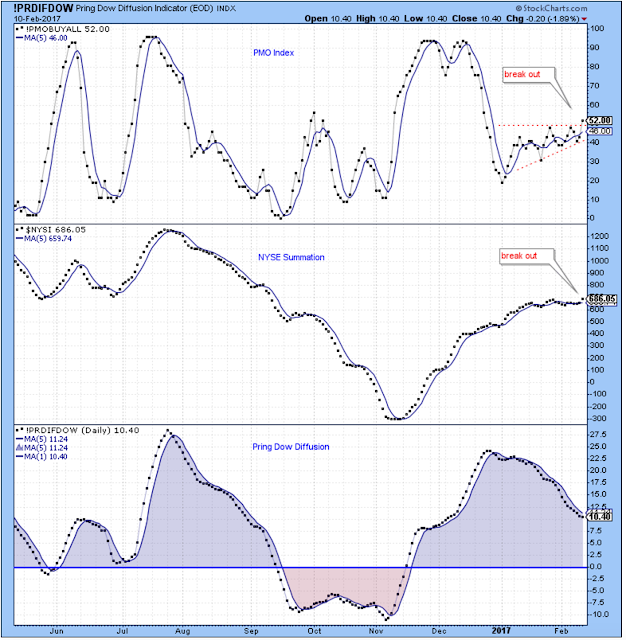
While we market followers look at the charts and declare "the top is near", the market ticks higher. And now the trusted indicators turn higher as well.
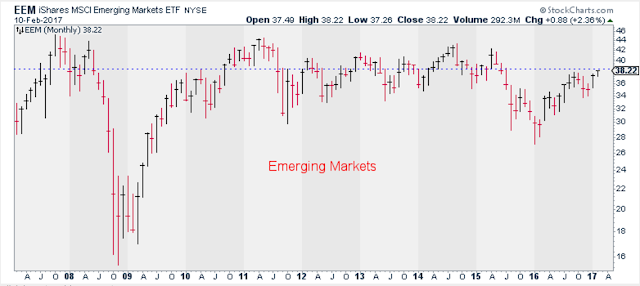
Sectors
Just an FYI... I have been developing a buy/sell indicator for the emerging markets, EEM. The indicator currently shows a strong uptrend, but nearing its peak (yes, another indicator near the peak).
Follow Up
The long-term outlook is positive.
The medium-term trend is up.
The short-term trend is up.
"Bullish sentiment is red hot. It signals caution.
The medium-term is well past the point where risk-reward favors the buyers.
The ValueLine newsletter medium-term market outlook has now switched to caution."
Disclaimer: I am not a registered investment advisor. My comments above reflect my view of the market, ...
more


Thanks for sharing