Russell 2000 Rally Should Fail For More Downside

Image Source: Pexels
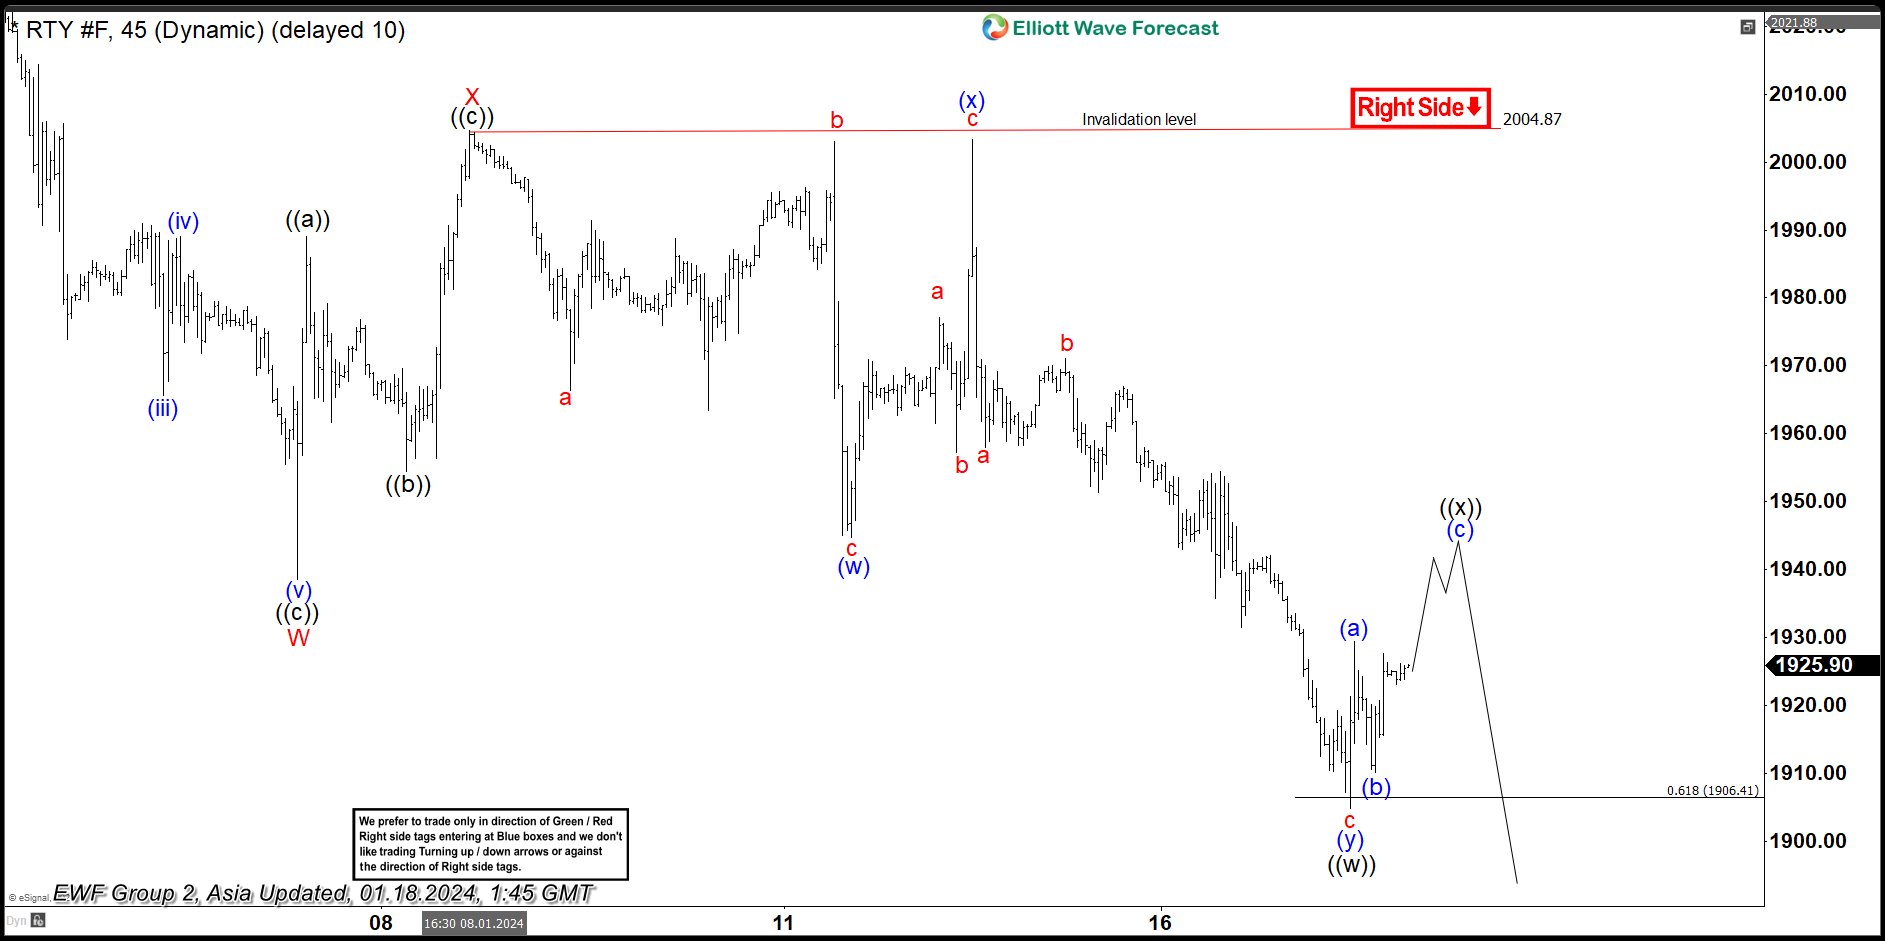
Short-term Elliott Wave View in Russell 2000 (RTY) suggests the decline from the 12.28.2023 high is unfolding as a double three Elliott Wave structure. Down from the 12.28.2023 high, wave W ended at 1938.6, and wave X ended at 2004.87. Wave Y lower is in progress as another double three in a lesser degree. Down from wave X, wave A ended at 1966.4 and wave b ended at 2003.10. Wave c lower ended at 1944.70 which completed wave (w). From there, wave (x) rally ended at t 2003.30 as a zigzag. Up from wave (w), wave a ended at 1977.10, and wave b ended at 1957.30. Wave c ended at 2003.30 which completed wave (x) in a higher degree.
Index resumes lower in wave (y) with internal subdivision as a zigzag. Down from wave (x), wave a ended in 1958 and wave b rally ended in 1971.10. Wave c lower ended at 1904.80 which completed wave (y) of ((w)). Expect the Index to rally in wave ((x)) to correct the cycle from 1.9.2024 high before it resumes lower. Rally is unfolding as a zigzag where wave (a) ended at 1929.4 and wave (b) ended at 1910.10. Expect wave (c) to end at 1934.2 – 1949.9 area which should complete wave ((x)) in a higher degree. Near term, as far as the pivot at the 2004.87 high stays intact, expect the rally to fail in 3, 7, 11 swing for further downside.
Russell 2000 (RTY_F) 45 Minutes Elliott Wave Chart
RTY_F Elliott Wave Video
Video Length: 00:10:34
More By This Author:
Natural Gas Perfect Reaction Higher From Extreme AreaEURUSD Short Term Looking For Further Downside
CrowdStrike Reacting From The Weekly Bluebox Area
Disclaimer: Futures, options, and over the counter foreign exchange products may involve substantial risk and may not be suitable for all investors. Leverage can work against you as well as for ...
more


