Russell 2000 Bearish Sequence Favors Downside

Image Source: Pexels
Rusell (RTY) shows a 3 swing from the July 31, 2023 high favoring further downside to reach equal legs target. It breaks below August 25 low confirming the idea. The drop from the July 31 high is unfolding as a zig-zag correction Elliott Wave structure. Down from the July 31 high, wave A ended at 1832.80 and Wave B's corrective rally ended at 1934. Wave C lower is currently in progress as a 5-wave impulse structure. The Index has broken below wave A at 1832.8 confirming the next leg lower has started.
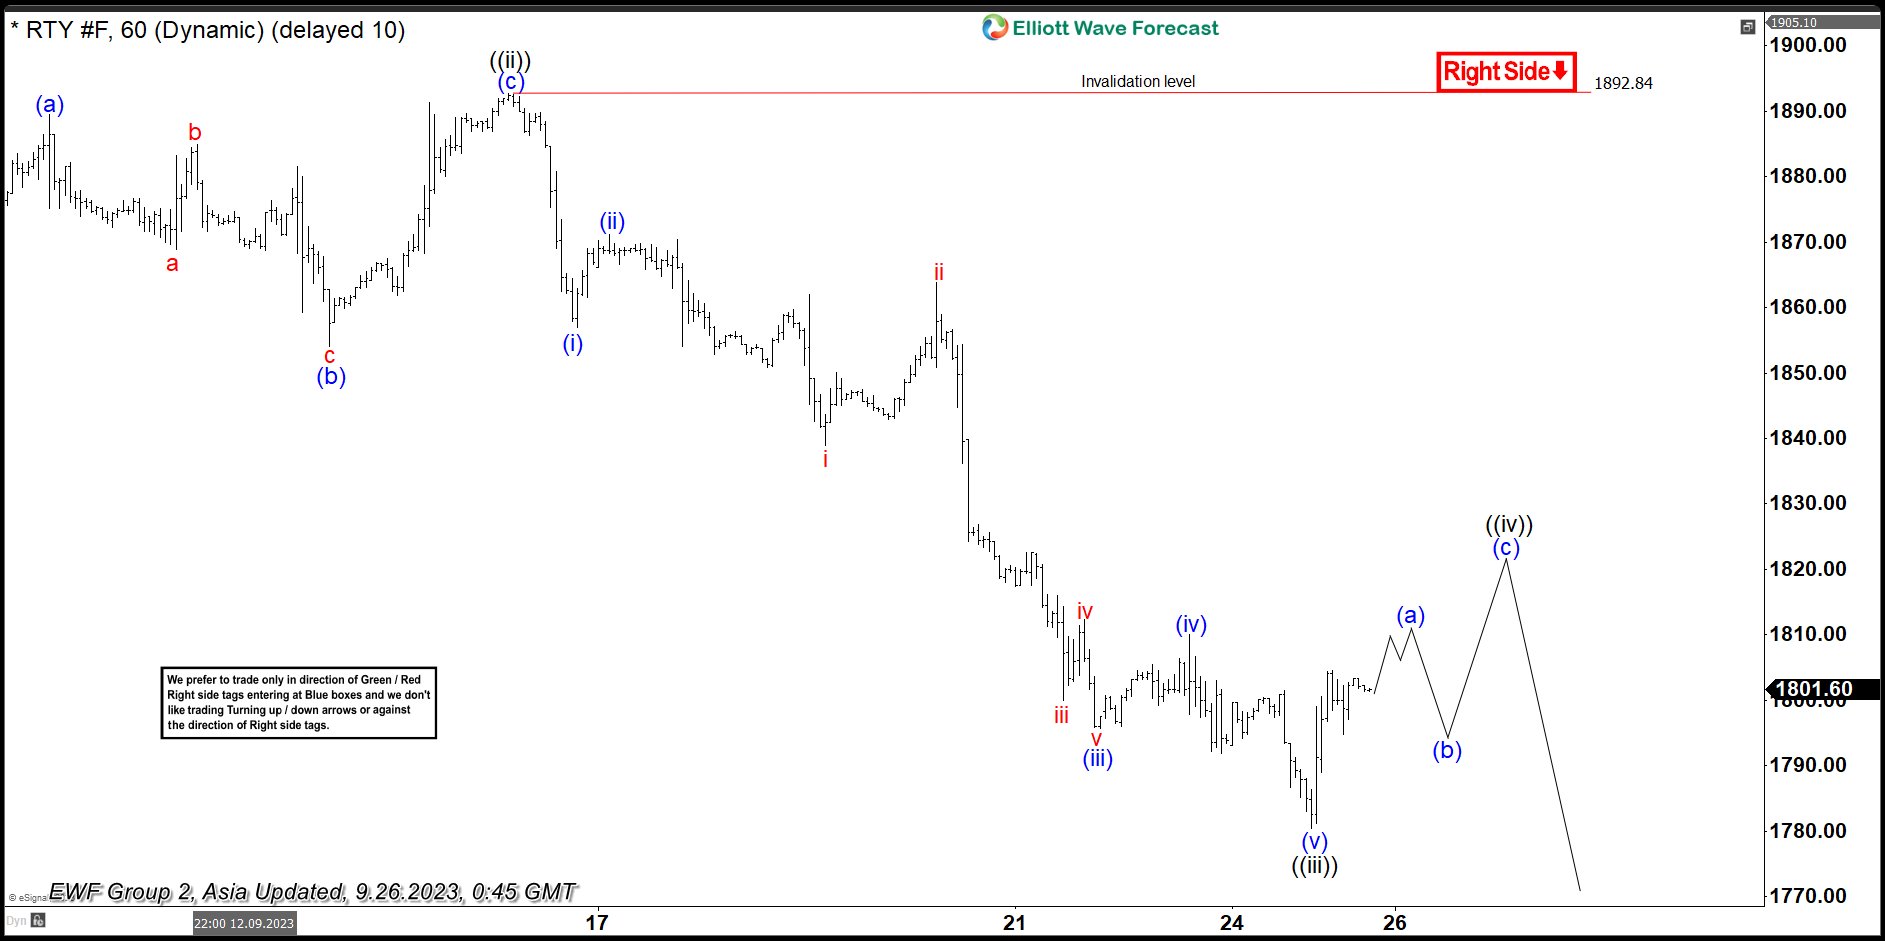
Down from wave B, wave ((i)) was completed at 1849.40. A flat wave ((ii)) ended at 1892.70. The 1-hour chart below shows the wave ((ii)) starting point. Index then resumed lower in wave ((iii)) ending at 1780.40. Currently, the market is developing wave ((iv)); therefore, we expect a corrective rally in 3, 7, or 11 swings before it resumes to the downside in wave ((v)) of C. Near term, as far as pivot at 1892.84 high stays intact, expect the rally to fail in 3, 7, or 11 swings for further downside. The potential target lower is 100% – 161.8% Fibonacci extension of wave A. This area comes from 1705 – 1749.
RUSSELL 60 Minutes Elliott Wave Chart
(Click on image to enlarge)
RUSSELL Elliott Wave Video
Video Length: 00:04:30
More By This Author:
McDonald’s Is Going To Give Us Buying OpportunitiesThe Dow Vs. Nasdaq Vs. S&P 500: What’s The Difference?
Dollar Index Should See Further Strength
Disclaimer: Futures, options, and over the counter foreign exchange products may involve substantial risk and may not be suitable for all investors. Leverage can work against you as well as for ...
more


