
Broken trend lines create resistance
Something you want to watch for is the resistance that forms when a stock breaks below its trend line. For most traders, once a trend line is broken, the trader simply dismisses the trend-line and forgets it never existed.
However, to the contrary, broken trend lines create a new layer of resistance.
Check out the Roblox (RBLX) chart below, and notice how when the stock gapped below the trendline on August 15th, on news that there were lawsuits filed against it over child safety concerns. It found support at the 50-day moving average (red line) and quickly bounced back. Then it tested the old trendline, closed just below it (orange line), and then saw a sharp rejection the following day.
(Click on image to enlarge)
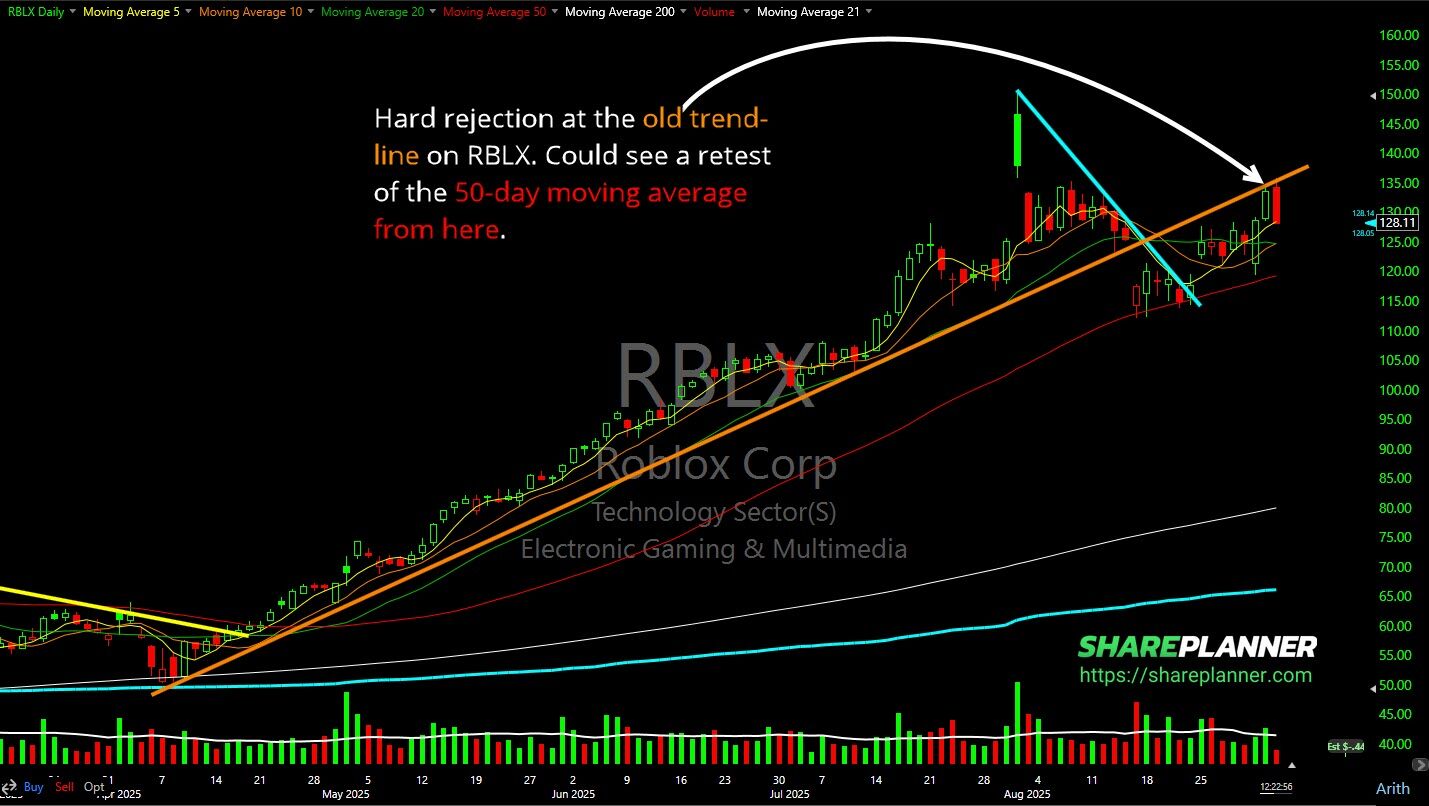
That is the power of broken trend lines and how they can become significant levels of resistance.
Now, not all is lost when broken trend lines become resistance; in fact, it can still march higher even still. Two scenarios can still play out: 1) the stock eventually recaptures the broken trend line, and all is merry again, or 2) it rides the under side of the broken trend line higher. The latter caps the stock’s potential gains, but still it manages to creep higher.
The third scenario is what you really have to watch out for and that is where there is a hard rejection like what you are seeing here starting on RBLX. That should be a huge red flag for any trader, if they see that unfold.
Obviously, not all trend lines are the same, and some are steeper than the others. If a particular broken trend-line has an extremely steep slope to it, I won’t pay it much attention because it will be difficult to test, unless there is a monumental move out of the stock, and if there is such a move, well, that is a welcomed development.
But it is the broken trend-lines that have been tested in the past on multiple occasions as previous support (and not just twice) that you want to watch out for as it pertains to price rejection at when the trend-line does break.
Final thoughts on broken trend lines becoming resistance
A lot of it comes down to managing the risk and planning your trade:
- What does the reward/risk look like on a retest of that broken trend-line?
- If there is a rejection, will you be able to salvage the trade for a decent gain still?
- And finally, is the trend-line so steep that it is unlikely to be tested down the road.
Remember too, that broken trend-lines coupled with other areas of resistance can make such areas even more challenging to break through, so if you see that on the charts, you’ll want to be even more care with the resistance and the trade that you are looking at taking or already in.
More By This Author:
Expect A Fed Rate CutSector Update: Friday, Aug 29
SPY Breaking Out Again


Comments
Log in or sign up to join the conversation.