Remember, Remember The First Days Of November
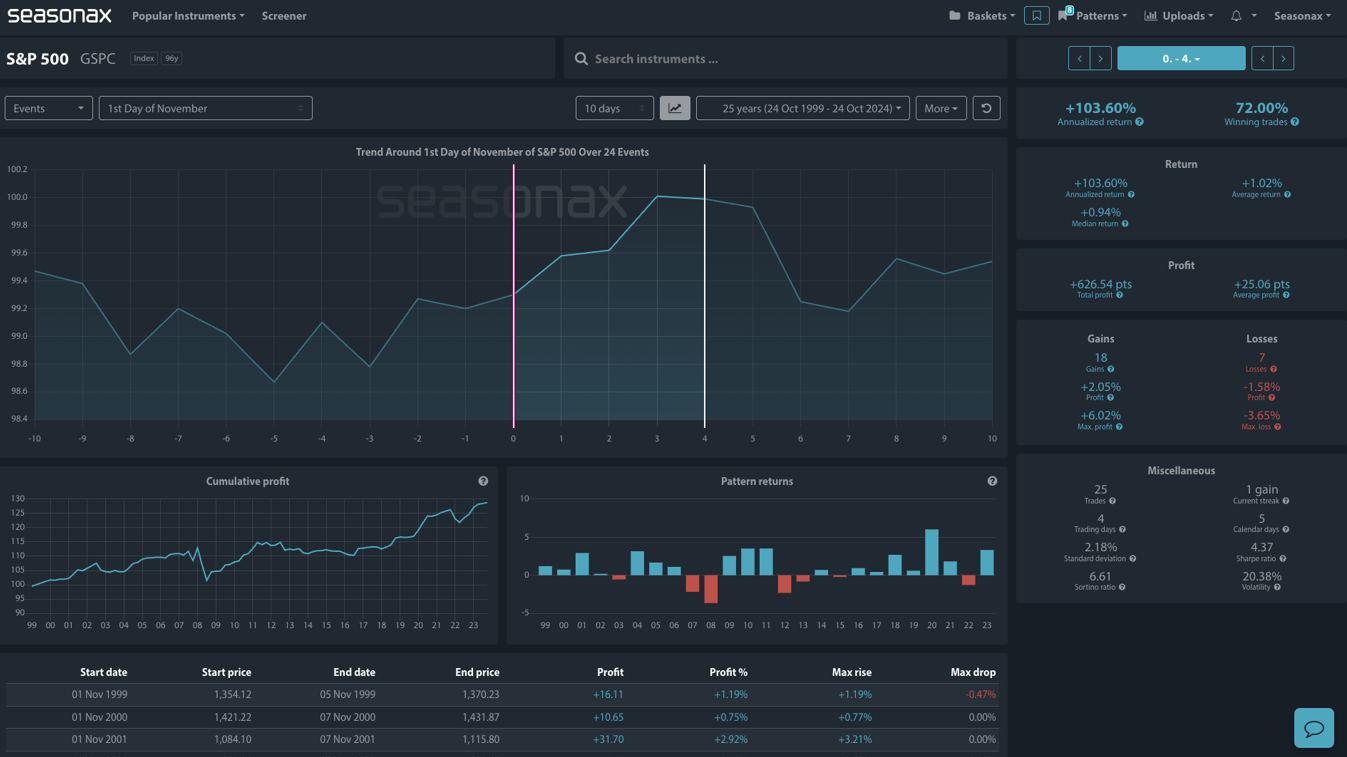
Over the past 25 years, the S&P 500 has shown a pattern of positive returns over the first four days of the month of November, with a strong annualized return of 103.60% and a notable 72.00% win rate for trades. The cumulative profit chart shows steady gains across 25 years, reaching a cumulative profit of over 125 points. On average, traders during this period see a return of 1.02% per event, with gains significantly outpacing losses. Notably, the maximum recorded profit from this period is around 6.02%. Losses, when they occur, average a decline of -1.58%, with a maximum drop of -3.65%.

This pattern presents a clear seasonal opportunity for those considering exposure to the index during this time frame. As always, investors should weigh this historical data against current market conditions, especially with the US election coming up but the consistency of past performance makes this a trend worth monitoring.
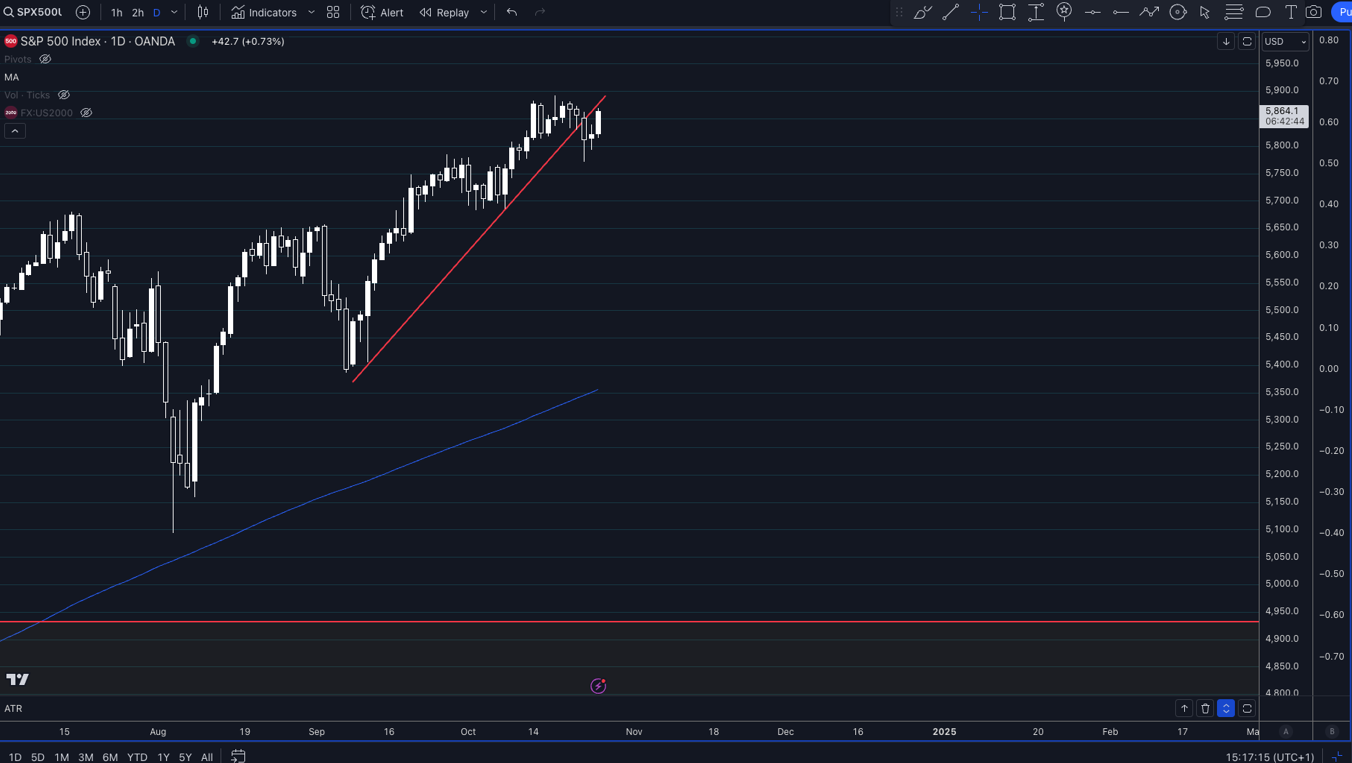
Technically, the S&P500 has had some sharp falls around the middle of last week and the major trend line marked on the daily will need to be clearly broken higher for bulls to remain in control.

Trade risks
While the seasonal outlook is favourable, risks remain. The US election is ahead soon and earnings are due, so there are significant risks to this outlook.
Video Length: 00:01:07
More By This Author:
The U.S. Dollar Index Reaction To Non-Farm Payroll ReportsMcDonald's Seasonal Strength Faces 2025's Economic Headwinds
Strong iPhone 16 Sales Boost Apple Amid Competitive Chinese Market
Disclosure: High Risk Investment Warning: CFDs are complex instruments and come with a high risk of losing money rapidly due to leverage. 75% of retail investor accounts lose money when trading ...
more


