

Image Source: Pexels
The Relative Strength Index (RSI) is one of the most popular technical indicators, yet few traders who use it truly understand how it is calculated, and how price moves will affect the RSI reading.
In the following video, we dive deep into the RSI, including how it is calculated, so you can understand how “false signals” may be generated under some circumstances, and what the RSI is really telling you.
video length 00:42:52
RSI Calculation
The RSI was developed by J. Welles Wilder.
RSI = 100 – 100/(1+RS)
RS = Average Gain / Average Loss over a selected period (14 by default)
The indicator moves between 0 and 100.
A value of 0 means every period in the last 14 periods dropped.
A value of 100 means every period in the last 14 periods rose.
If average gains over the last 14 periods are larger than average losses, the RSI will be above 50. The more lopsided the gains are relative to losses, the closer to 100.
If average gains over the last 14 periods are smaller than average losses, the RSI will be below 50. The more lopsided the losses are relative to the gains, the closer to 0.
RSI Quirks
Now that you understand the calculation, there are a few quirks to be aware of.
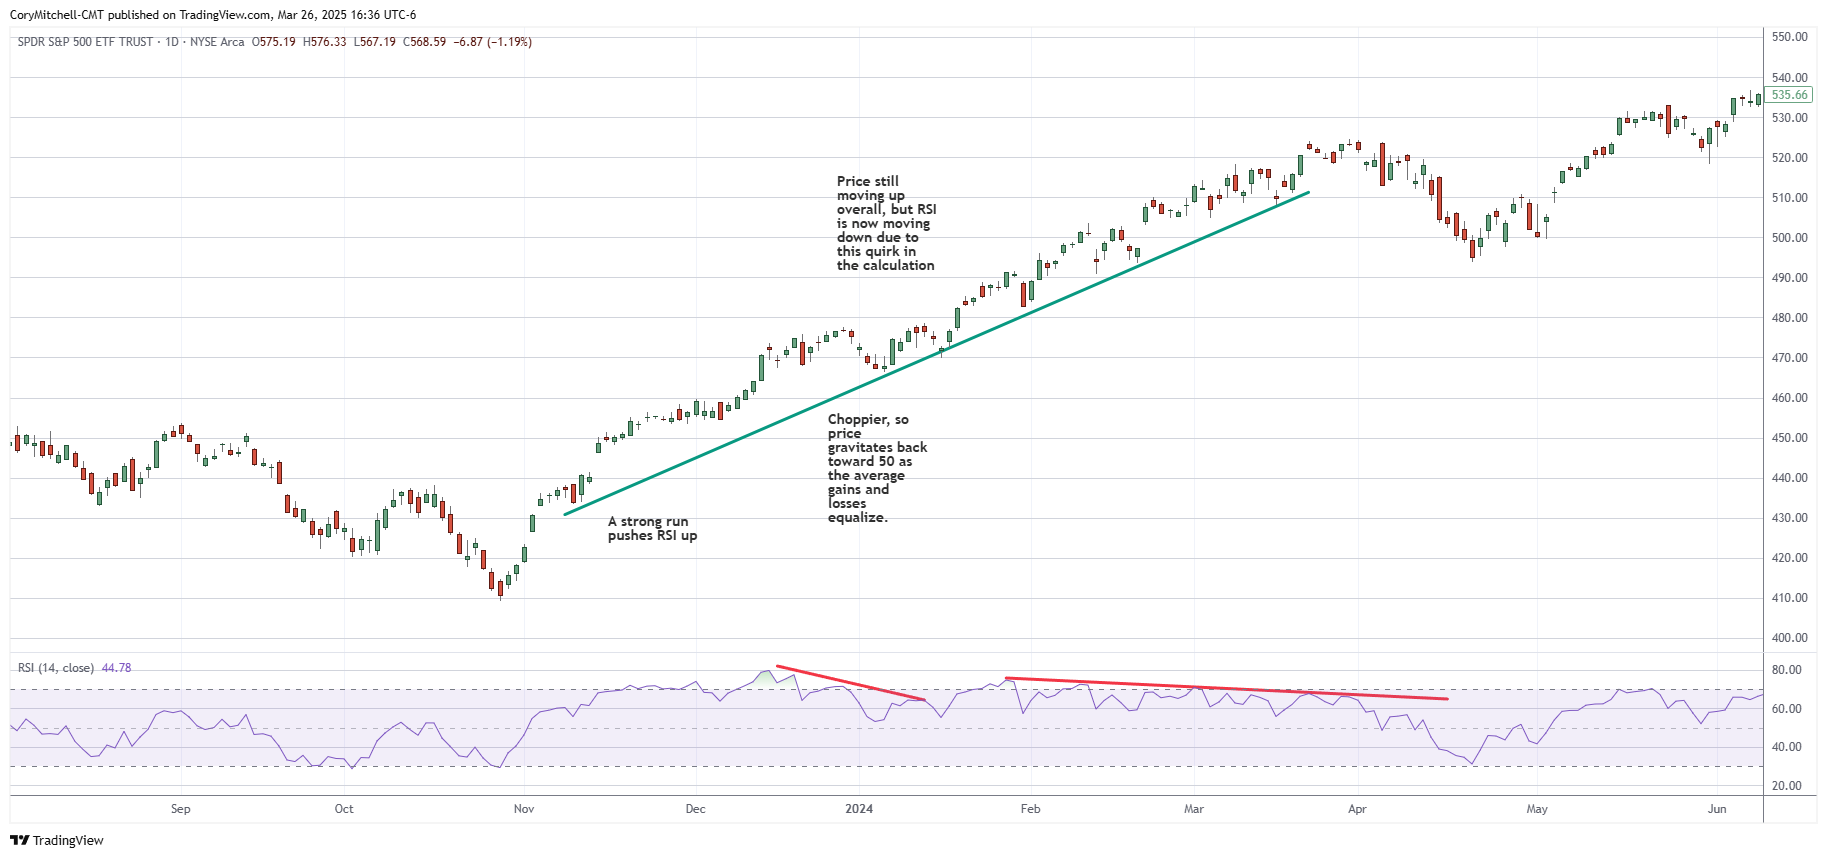
The main one is that if there is a very sharp price move up (or down) this will spike the RSI. Average gains are much bigger than losses. But then let’s say the price action slows down a bit. It takes a breather. Now, there more of an assortment of red and green candles. The price may still be moving up overall, but what will happen to RSI?
It will drop because now the losses and gains are more equal in the chopper price action. More equality in the candles means moving back to 50 from an elevated level.
This creates a divergence. Which we will discuss in a bit. Many people falsely view this as the price running out steam and that it may reverse. But the RSI doesn’t know that (no one does).
All the RSI is doing is saying that gains massively outstripped losses (during the spike) and now they are normalizing. RSI won’t get as high as it did before, even though price may still be rising overall. Average gains are just not outpacing losses as much as before. It will only get as high again if average gains outstrip average losses to the extent they did before.
All charts are provided by TradingView, the charts I use.
(Click on image to enlarge)
A similar issue occurs in the MACD.
Now that you know a bit more about the inner workings of the RSI, let’s at some ways the RSI has traditionally been used to trade.
RSI Overbought and Oversold Levels
The terms overbought and oversold can be deceiving. Most people think that if something is overbought it should drop. And if something is oversold it should rally.
Welles Wilder considered a reading of 70 or above overbought. A reading of 30 or below oversold.
When the RSI reaches these levels, it does not mean a price reversal is imminent. If the RSI reaches 70, what it does mean is that average gains are roughly double what average losses are over the period.
RSI = 100 – 100/(1+RS)
RS = $2 / $1 = 2
This means up candles averaged $2 while down candles averaged $1.
RSI= 100 – 33.3 = 67
Oversold means losses are roughly twice as big as gains over the period.
RSI = 100 – 100/(1+RS)
RS = $1 / $2 = 0.5
RSI= 100 – 66.7 = 33
Price can sustain this for long periods of time, where gains stay significantly larger than losses on average, or vice versa. Although there is no guarantee of this. RSI is simply measuring average gains versus average losses.
On their own, I have not found these levels to be particularly useful. Uptrends can stay in overbought territory for extended periods of time, and downtrends can stay near oversold for a long while. In rangey conditions prices may move between overbought and oversold regularly.
You may find them useful. Add the RSI to your chart and look at various uptrends, downtrends, and ranging periods. See if the RSI overbought and oversold levels helped you in any way. If they do, great. If they don’t, there is no point using them.
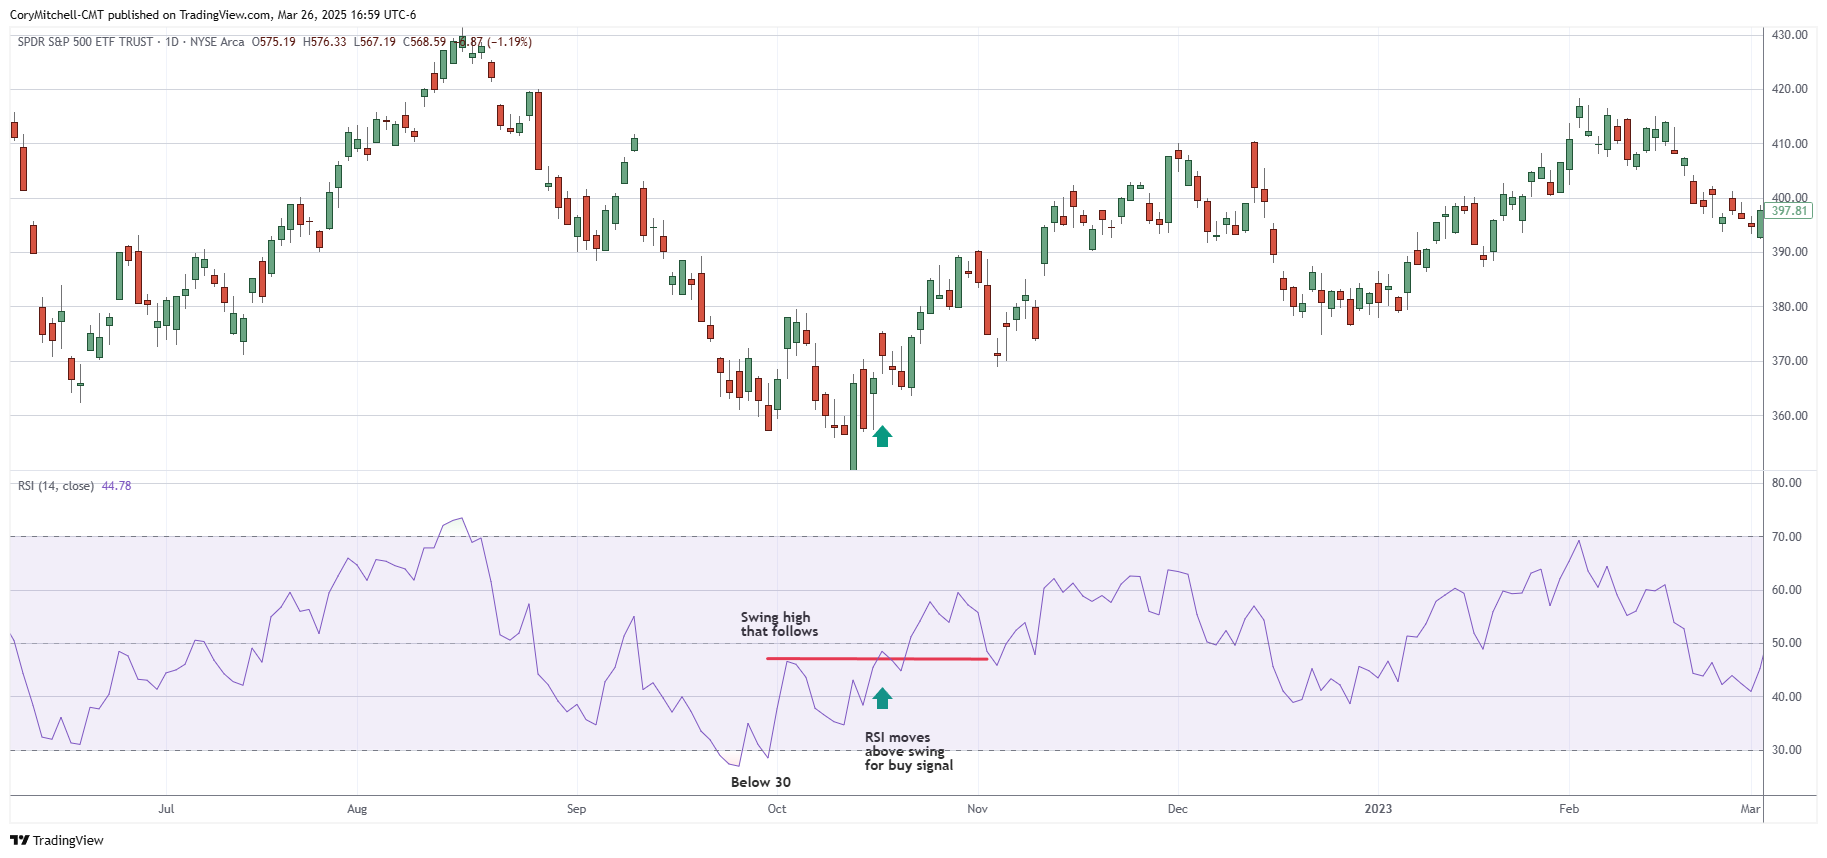
RSI Failure Swings
Failure swings, developed Welles Wilder, build off the oversold and overbought levels, but add in additional criteria for potential signal trades.
- Buy signal: RSI goes oversold (below 30). Moves above 30. Pulls back but stays above 30. Takes out the prior swing high (prior to pullback). This may indicate the price is bottoming.
(Click on image to enlarge)
- Short signal: RSI goes overbought (above 70). Moves below 70. Pulls up but stays below 70. Takes out prior swing low (prior to pullback). This may indicate the price is topping.
The following trade would have been a loss. The second one, depending on the exit points used, did see a drop after it (but there was a rally before the drop).
(Click on image to enlarge)
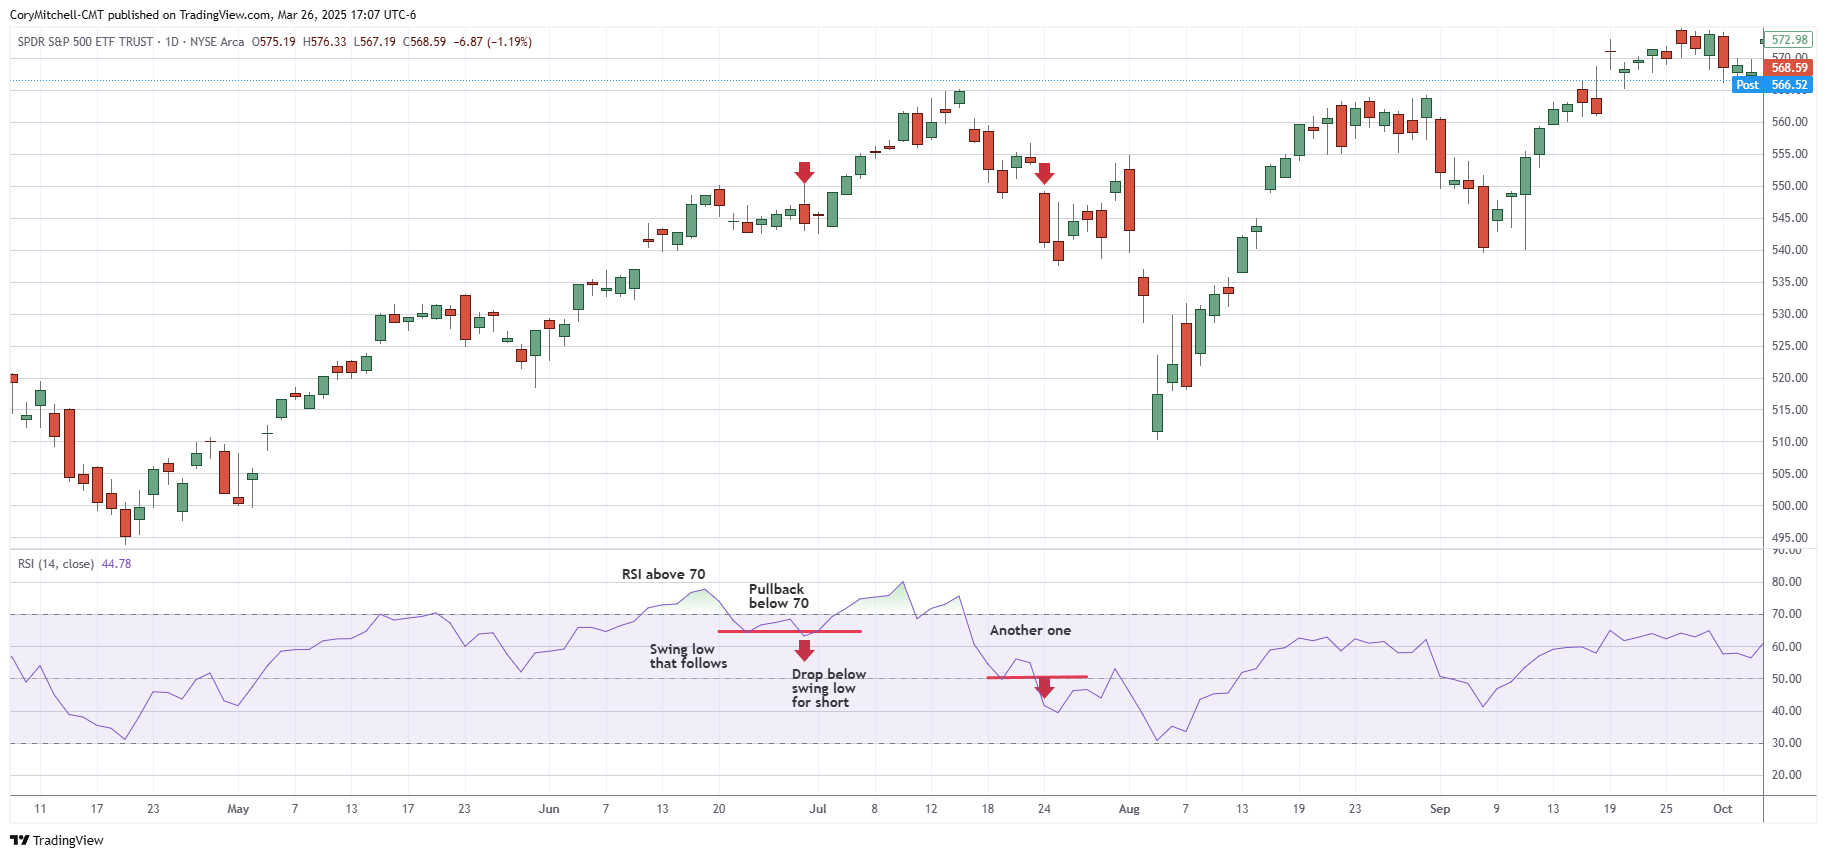
Failure swings do not occur on every bottom or top.
Problem: False signals occur when price moves from strong movement to choppy. The price may not be reversing. It may simply go from oversold and gravitate back toward 50 as losses and gains level out.
Find many occurrences of RSI Failure Swings before deciding to trade them. This article only discusses the entry technique. Consider how you would exit trades as well, both for profit and when to cut losses. Only consider using them after you have found they provide a profitable edge over many trades based on the rules you have chosen.
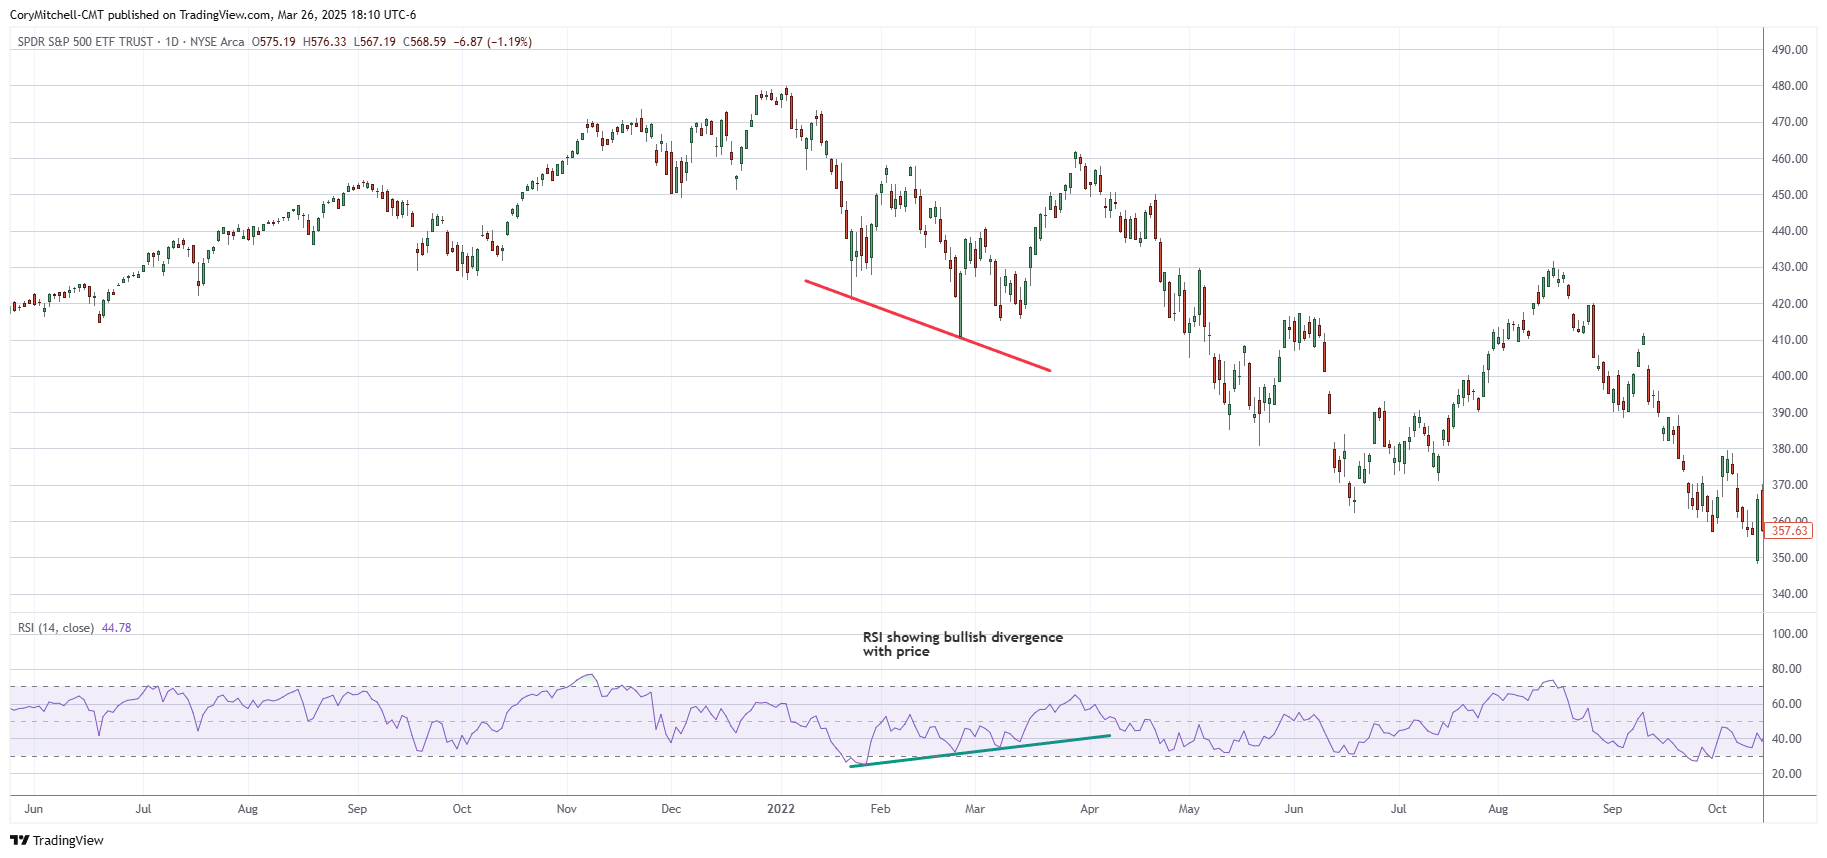
RSI Divergence
Divergence occurs when RSI moves one way while price moves the other. The underlying assumption about RSI divergence is that the RSI will win out over price. Basically, trust the RSI direction. You can decide for yourself if this is a valid assumption or not. I do not buy into it, based on the quirks mentioned earlier in the article.
- Bullish Divergence – Price is moving lower as RSI is moving higher
- Based on the assumption that RSI will win out, this indicates price could start moving higher
- It is a poor timing signal, as divergence can last a long time.
(Click on image to enlarge)
- Bearish Divergence – Price is moving higher as RSI is moving lower
- Based on the assumption that RSI will win out, this indicates price could start moving lower
- It is a poor timing signal, as divergence can last a long time.
(Click on image to enlarge)
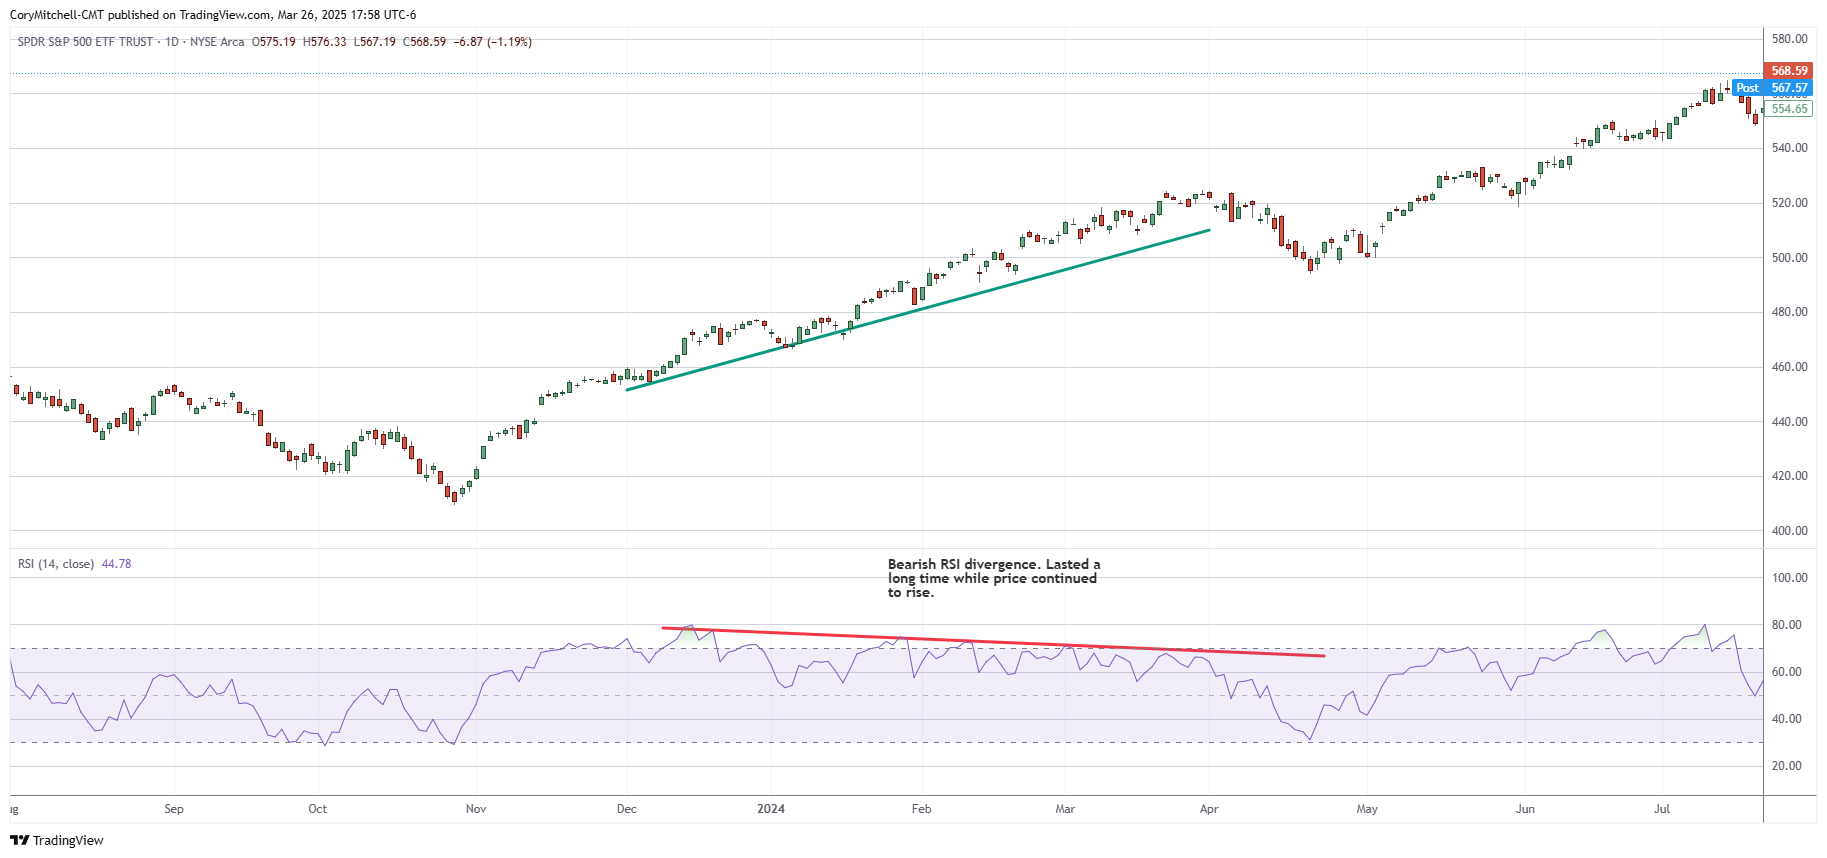
In the above example, there is a clear divergence between the price and RSI. Yet price continues to move higher, and RSI continues to drop, for a long time. If you understand how the RSI is calculated and what it is measuring, how this can happen will no longer be a mystery.
As noted, divergence tends to be a poor timing signal, which is another way of saying it could provide random signals. Prices move up and down regularly, so eventually there will always be a reversal. It is easy to say that divergence caused the ultimate reversal in price. But we can’t ignore how many divergences there were (I count 6) that were false signals before the price actually reversed.
Divergence is traditionally used to spot potential price reversals. Ideally, let price action confirm. Divergence does not occur on every bottom or top.
Problem: False signals occur when price moves from strong movement to choppier.
As with all the other methods, test it out for yourself. If it helps your trading decisions, great. Possibly you combine it with other tools to make it more effective. Either way, test it out for yourself before using it, and get clear on exit rules as well, which will be required to see if it is worthwhile to trade with.
RSI Trend Ranges
Constance Brown noticed that uptrends tend to see the RSI stay at 40 or above and routinely hit 70 or higher. She noticed downtrends tend to stay below 60, and routinely hit 30 or lower.
Such ranges may provide analytical benefit, or potentially trade signals. For example, when the RSI is no longer acting like it should during a trend, that could be a warning sign. If an apparent uptrend in price is no longer reaching 70 on the RSI, holding more below 60, and reaching 30 on the dips, that is not uptrending behaviour anymore, for example.
Losing trades will happen with all methods, but it is important to understand that the same issue that plagues the RSI with the other methods also affects this one. There may still be a trend, yet if the price moves are only slightly lopsided (gains vs. losses), then the RSI will gravitate toward 50. Then any little short-term quick move in price could break the RSI out of its “trend range” even though the price trend may still be very much intact.
(Click on image to enlarge)
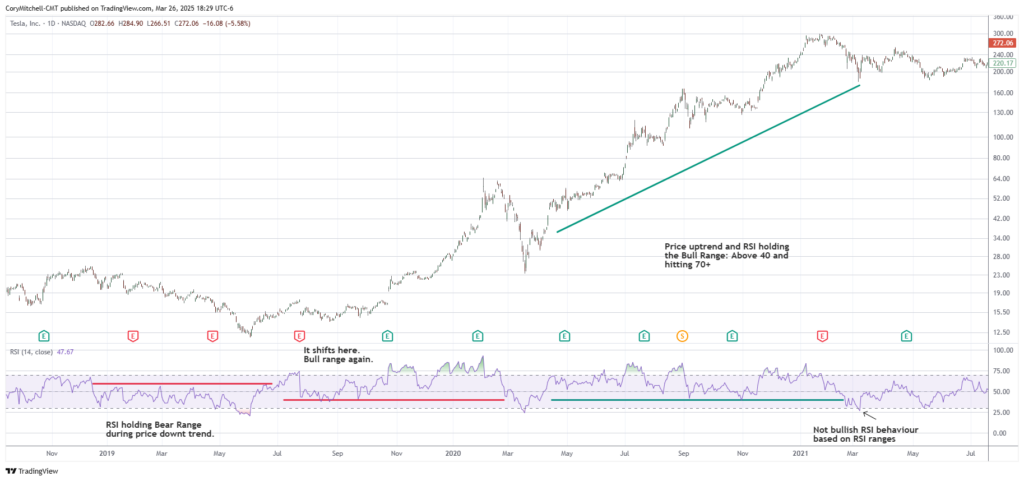
RSI ranges can be an interesting confirmationary tool, and may warn when an uptrend is no longer acting like an uptrend, for example, and may warrant caution going long or staying long.
Test out RSI ranges for yourself to see if you find them useful.
RSI Positive and Negative Reversals
Positive and Negative Reversals were developed by Andrew Cardwell. At first glance, they may appear the same as divergences, but they are not.
In the RSI Divergences section, I discussed that the underlying assumption is that the RSI direction will win out (at least that is how divergences are commonly used).
With a Positive and Negative Reversal, the underlying assumption is that we want to trade based on the price direction. The structure of positive and negative reversals are also flipped compared to a divergence.
- Positive Reversal = Buy = RSI Lower Low, Price Higher Low
- Lower RSI low doesn’t go below 30, price at higher swing low
(Click on image to enlarge)
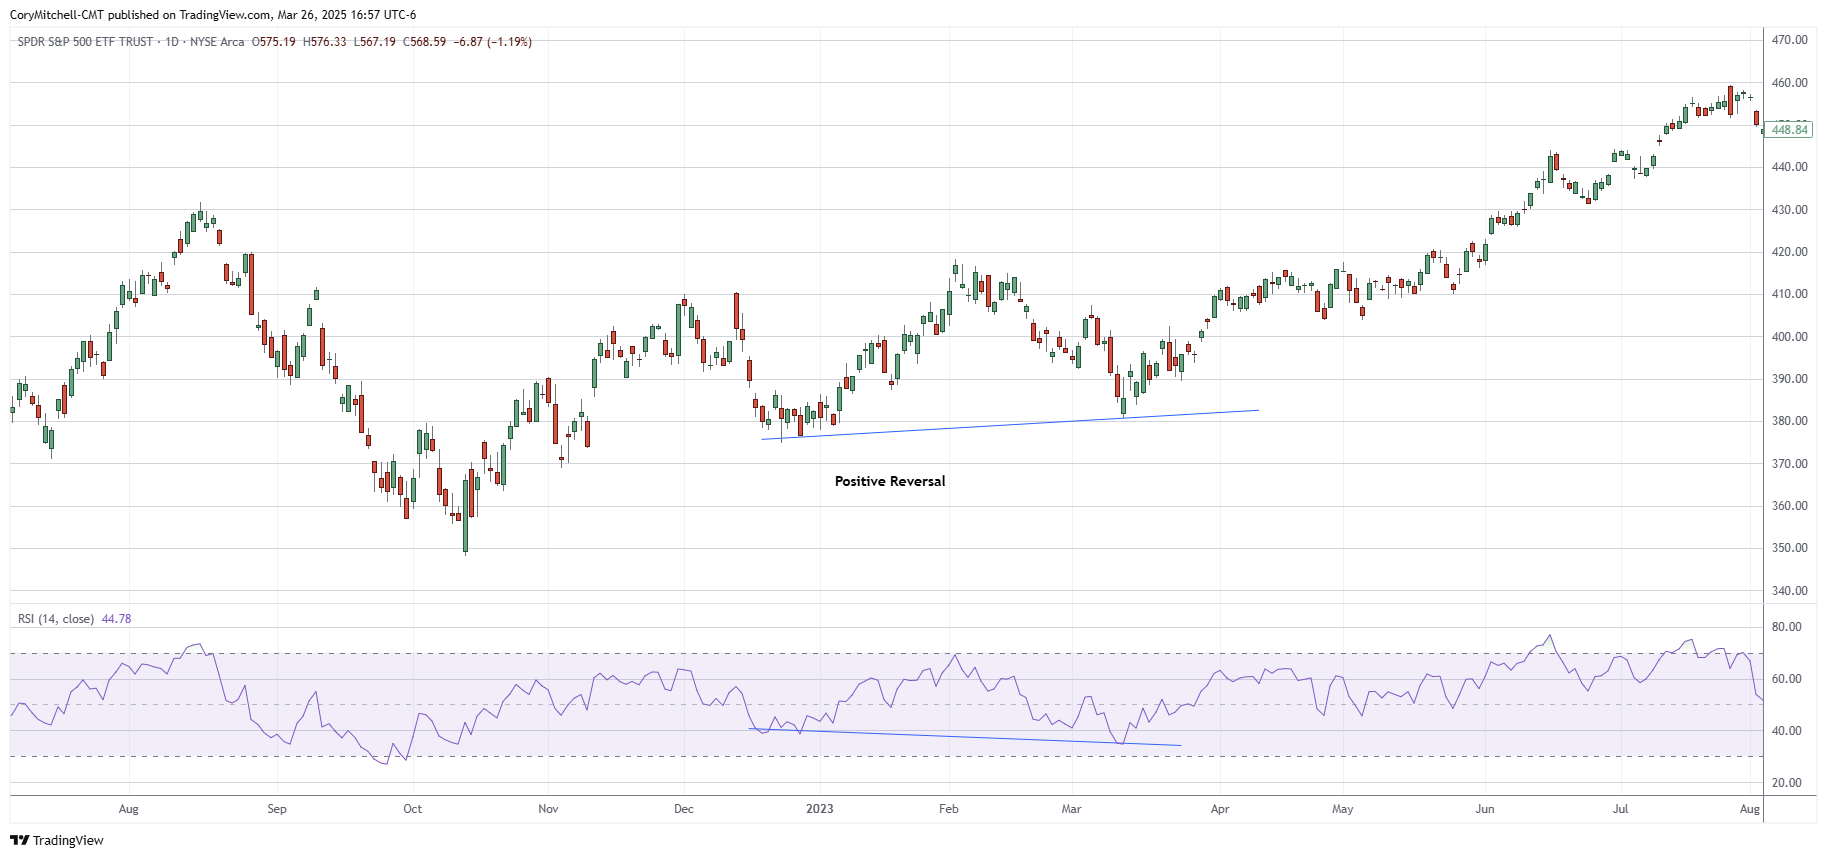
While price and the RSI are diverging, that is where the similarities between a Positive Reversal and divergence end. With this method, Cardwell trusted the price direction (making higher lows) and used the lower RSI as a catalyst for a long trade.
Per the rules mentioned above, the RSI doesn’t drop below 30 on the lower RSI low.
- Negative Reversal = Sell/Short = RSI Higher High, Price Lower High
- Higher RSI high doesn’t go above 70, price at lower swing low.
(Click on image to enlarge)
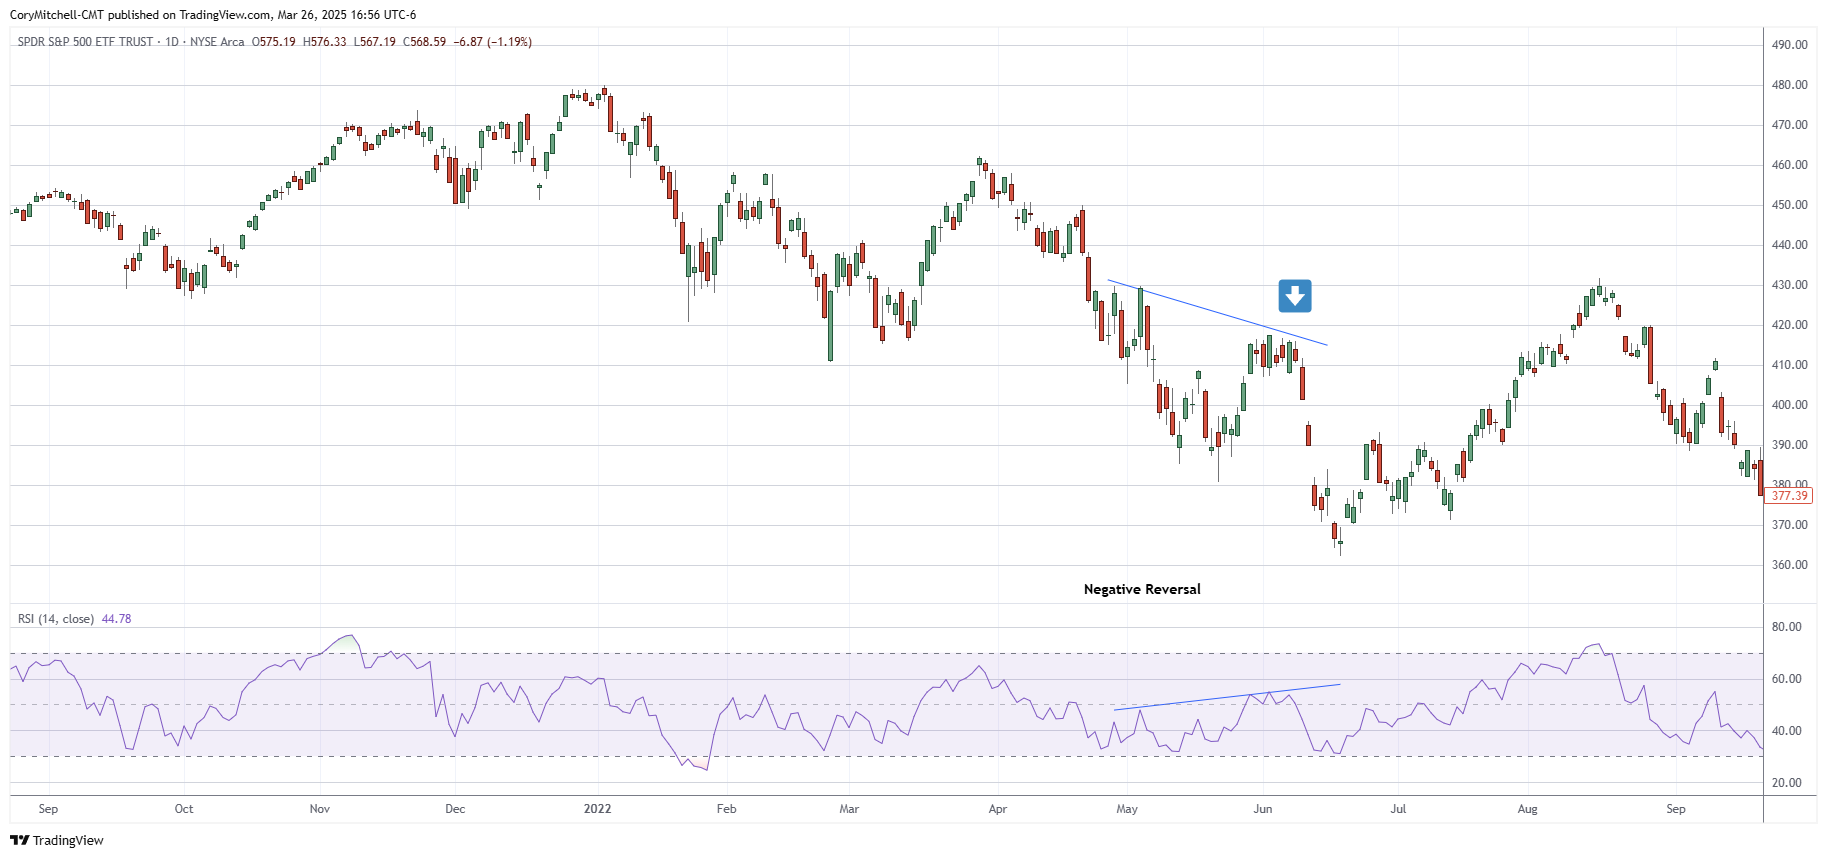
In the example, the RSI doesn’t move above 70 on the higher RSI high. At the same time, the price is making lower lows. This presents a potential selling opportunity.
This method places more reliance on price, and takes advantage of the quirks of the indicator to potentially spot some trades. Find lots of examples, that work and don’t work, to see if positive and negative RSI reversals are worth incorporating into your strategy.
I didn’t discuss using RSI for exits in this article, so be sure to consider your exit points before doing any testing or using the RSI for trade signals.
Do I Use RSI?
No. I trade price action. I have used RSI at times in the past, but not anymore. It did not add value to my trading.
That is not to say the RSI is bad, or only trading price action is better. That is just my choice. I have winning trades and losing trades using price action, just as someone who uses the RSI would.
RSI is just a tool. It is the craftsman using the tool that ultimately determines if it is a profitable tool or not.
More By This Author:
Stock Day Trade Of The Day: IonQ, ZenaTech, Quantum Computing, D-Wave QuantumTrade Of The Day: IonQ, Red Cat Holdings
EURUSD Day Trading Charts, Trades, And Notes For June 2024


Comments
Log in or sign up to join the conversation.