
Last Thursday I joined Stuart Varney on Fox Business to discuss Stock Market, Fed, Cuts, Liquidity Mismatch, Disney, Generac and more. Thanks to Christian Dagger, Preston Mizell, and Stuart for having me on.
On Tuesday, I joined Trinity Chavez on NYSE TV to discuss Wholesale Inflation, Fed, Earnings, GDP, Market Outlook and more. You can find it here.
Mini Update Cooper Standard
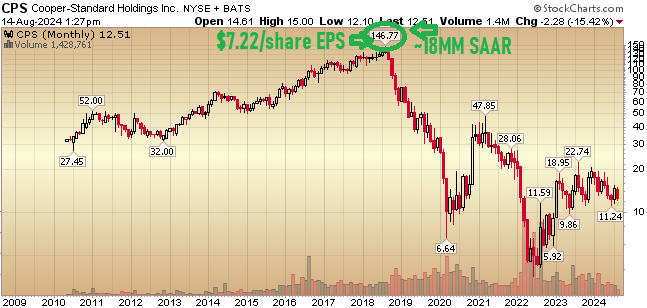
Last week we went into detail on Cooper Standard’s earnings, outlook and prospects moving forward – as well as our original thesis from May 2022 when we initiated the position ~$5.50/share. You can find it here.
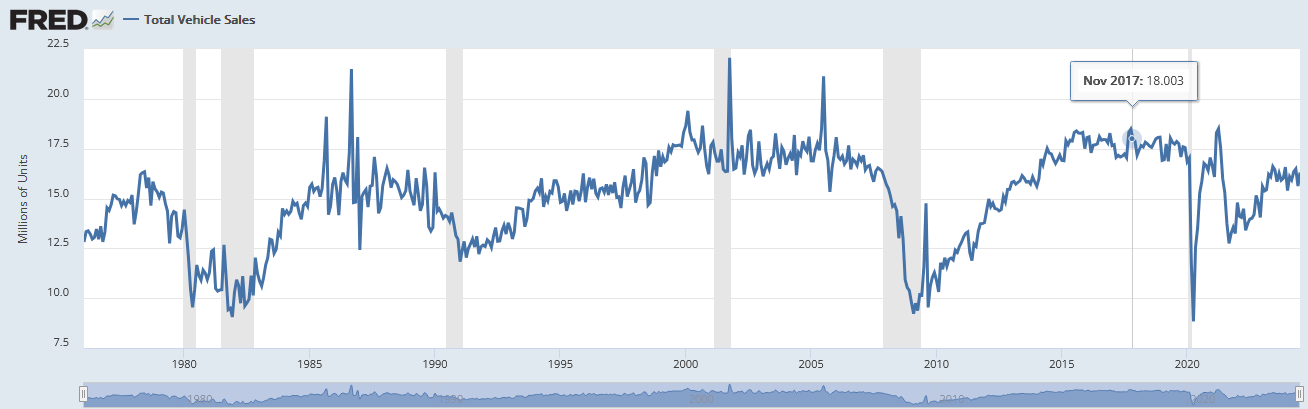
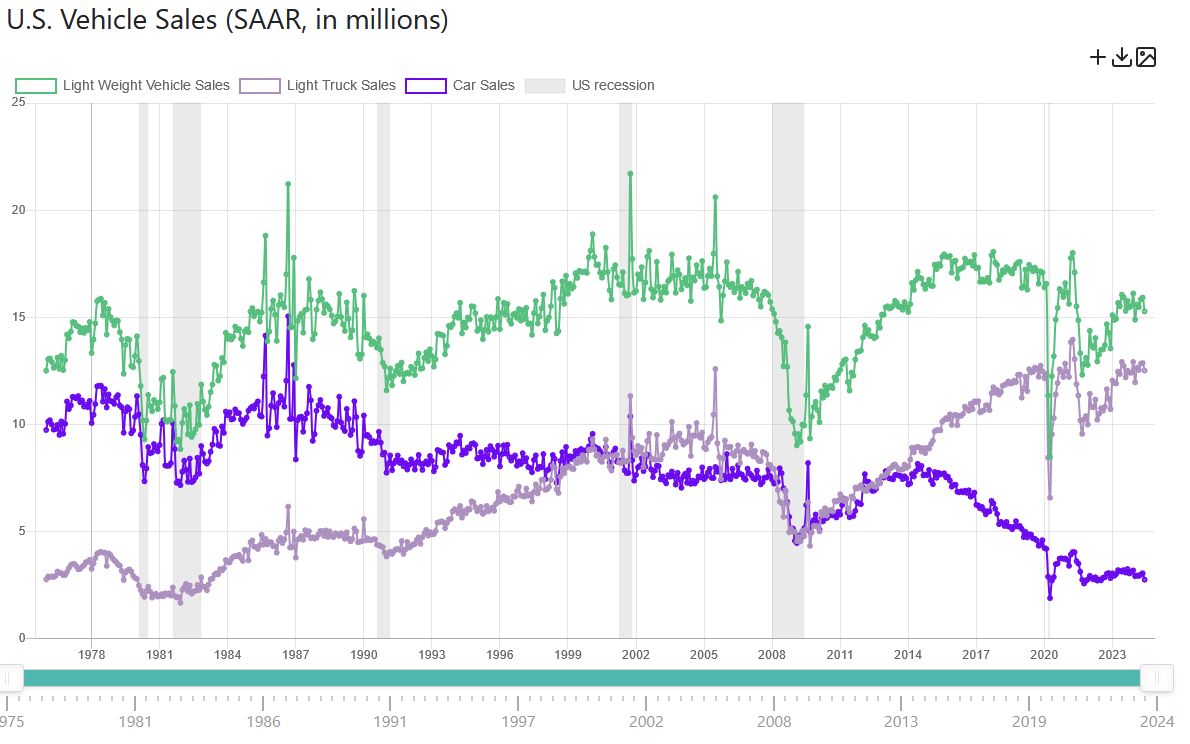
One concept I wanted to point out is that since 1980, every single cycle has peaked out at ~18M SAAR. Expectations for 2024 were that the industry would do 16.1M this year. It has since been revised down to 15.8M.
(Click on image to enlarge)
One of the key factors – which is a leading indicator of volumes – is incentives offered. In recent years, the OEMs have experienced the halcyon days of controlling supplies and selling above MSRP. With a wink and a nod, all OEMs followed suit – until now. As inventories build (partially due to the artificial EV push that was not met with natural demand), incentives are starting to accelerate. This is the key leading indicator of increasing volumes to come.
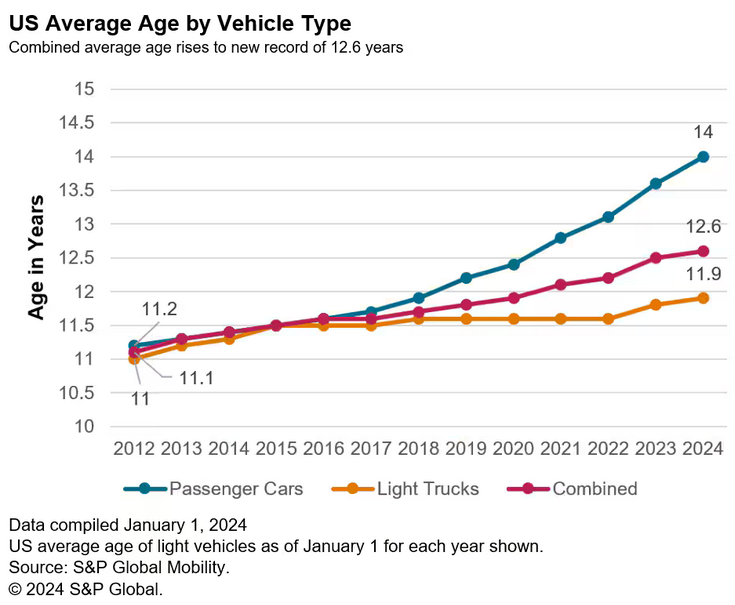
To the layperson, one would think that they are increasing incentives because no one wants to buy cars – therefore volumes will fall. The opposite is true. The high rates, high prices and low supply has led to pent up demand with the average car on the road ~13 years old (record high). The Korean manufacturers will continue to ramp lower cost alternatives forcing the US and Japanese OEMs to follow suit and offer incentives to move their current inventories.
This will hurt OEM margins (GM, F, STLA, TM, etc), so to make up the profits they will have to produce more volume to meet profitability goals. If they hold out for price they will lose meaningful share. The “race to the bottom” will be on. This is good for the consumer, good for auto suppliers that benefit from volumes and less so for OEMs. We don’t own any OEM’s, our play is for volume through CPS.
So what could this actually mean for CPS? Forget about what it means when production peaks at 18M several years out (like every cycle for the past 45 years). Just a move from 15.8M to 16.1M will have a massive impact to EPS (due to CPS operating leverage). We estimate that another 300k cars could yield ~$50M straight to the bottom line – given how efficiently CPS is running. That implies ~$3/share in earnings.
As a friendly reminder – when CPS was bloated and running inefficiently in 2017, the stock traded up to $146/share on ~$7/share of EPS (~20x P/E). Historically when profitable, CPS has traded between a trough multiple of 10x EPS and a peak multiple of 20x.
So if we can go just to 16.1M SAAR and earn $3/share at a 10-20x multiple ($3 EPS x 10 or 20 (multiple) = $30-$60 share price), what could the business do on a peak 18M SAAR a few years out? The answer is a lot more than it did on 18M SAAR in 2017 because the margins are better and the cost structure is rationalized. An assumption of $3/share for every 300k additional SAAR after 16.1M might be too optimistic, but what if we cut that in half? $1.50 more EPS per 300k cars from 16.1M to 18M = 6.33 x 1.5 = $9.50 EPS + $3.00 EPS (from 15.8-16.1 SAAR) = $12.50/share EPS (or ~75% more earnings power than when it traded at $146).
There are no guarantees in anything. There is always execution risk, market risk, unknown risk, etc. That said, no matter how conservatively you continue to cut in half potential upside, you still wind up with a very attractive risk/reward profile – which is why we’ve continued to add shares along the way. Just as we rarely buy 100% all at once, we rarely sell all at once.
To be pessimistic you have to take the view that LESS people will buy cars when the Fed lowers rates and LESS people will buy cars when the average automobile ages past 14 years old. I’m not willing to make those bets – which is why we have a material position in Cooper Standard.
(Click on image to enlarge)
Bank of America Fund Manager Survey Update
On Wednesday, we put out a summary of the monthly Bank of America “Global Fund Manager Survey.” This month they surveyed institutional managers with $508B AUM.
Here were the key points:
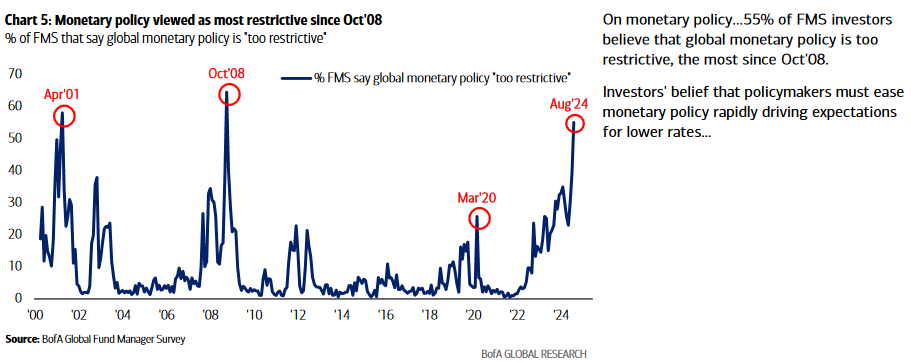
1. The most number of survey participants (in 16 years) believe monetary policy is “too restrictive.” The last few peaks in this level of “too restrictive” belief marked at or near bottoms to buy cyclicals, small caps, dividend payers and international stocks. With the Fed Funds rate > 200bps above inflation – we concur with this point of view.
(Click on image to enlarge)
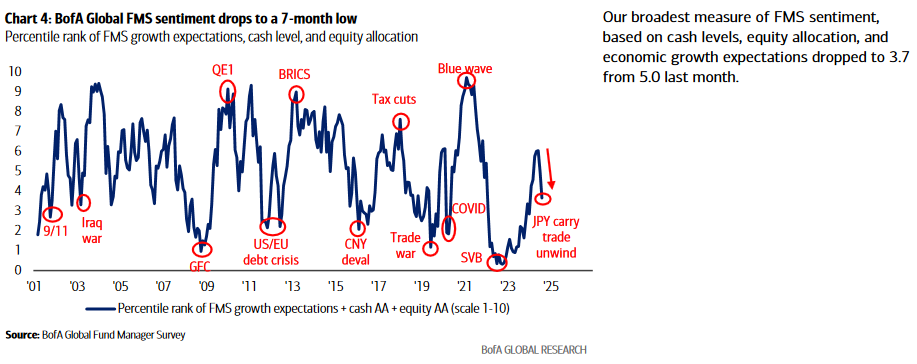
2. Sentiment is climbing the “wall of worry” but not at extreme levels:
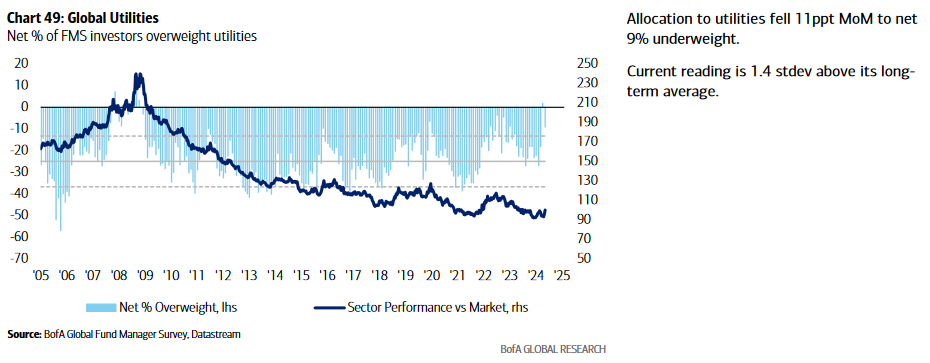
3. Utilities exposure has skyrocketed to 1.4 SD above its long-term average:
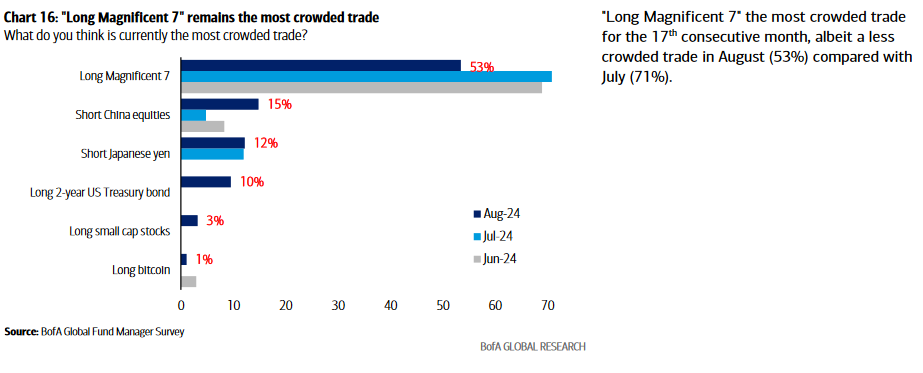
4. Long Magnificent 7 is still the most crowded trade despite a recent 18% correction:
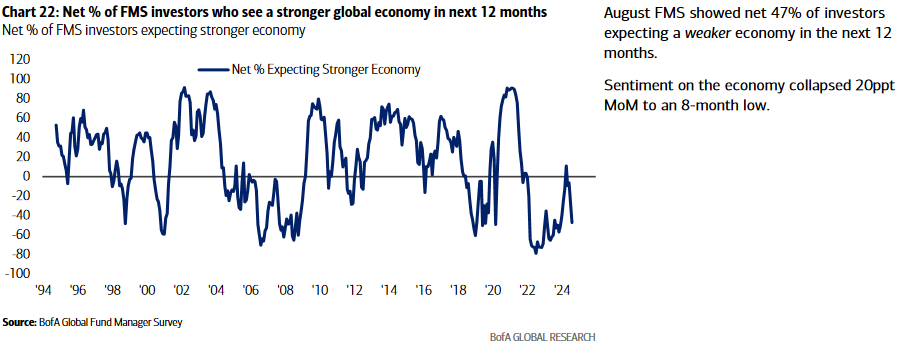
5. Managers’ outlook/pessimism on economy mirrors levels you see near market bottoms versus market tops:
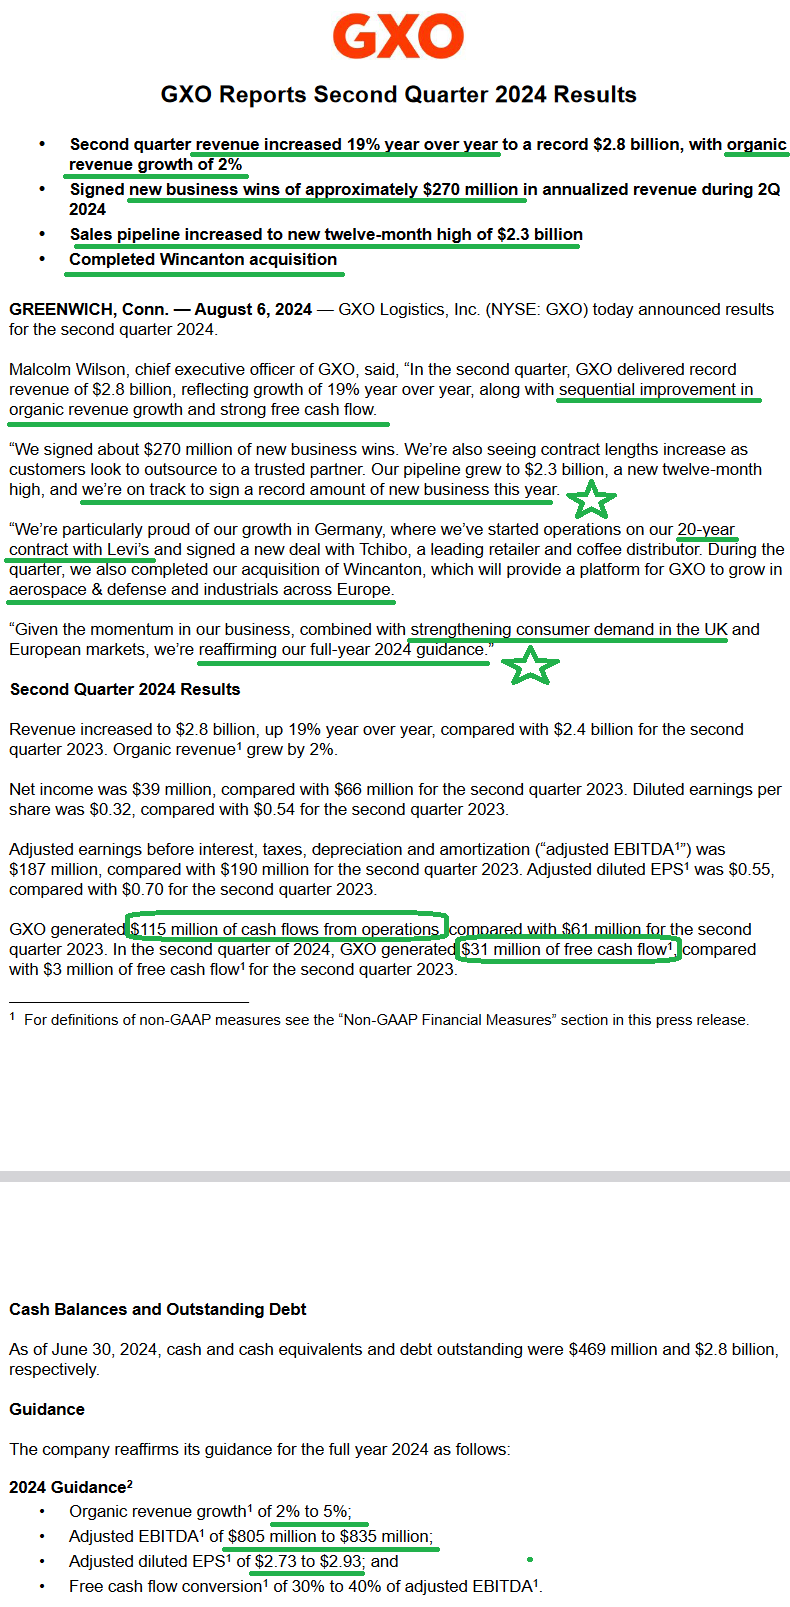
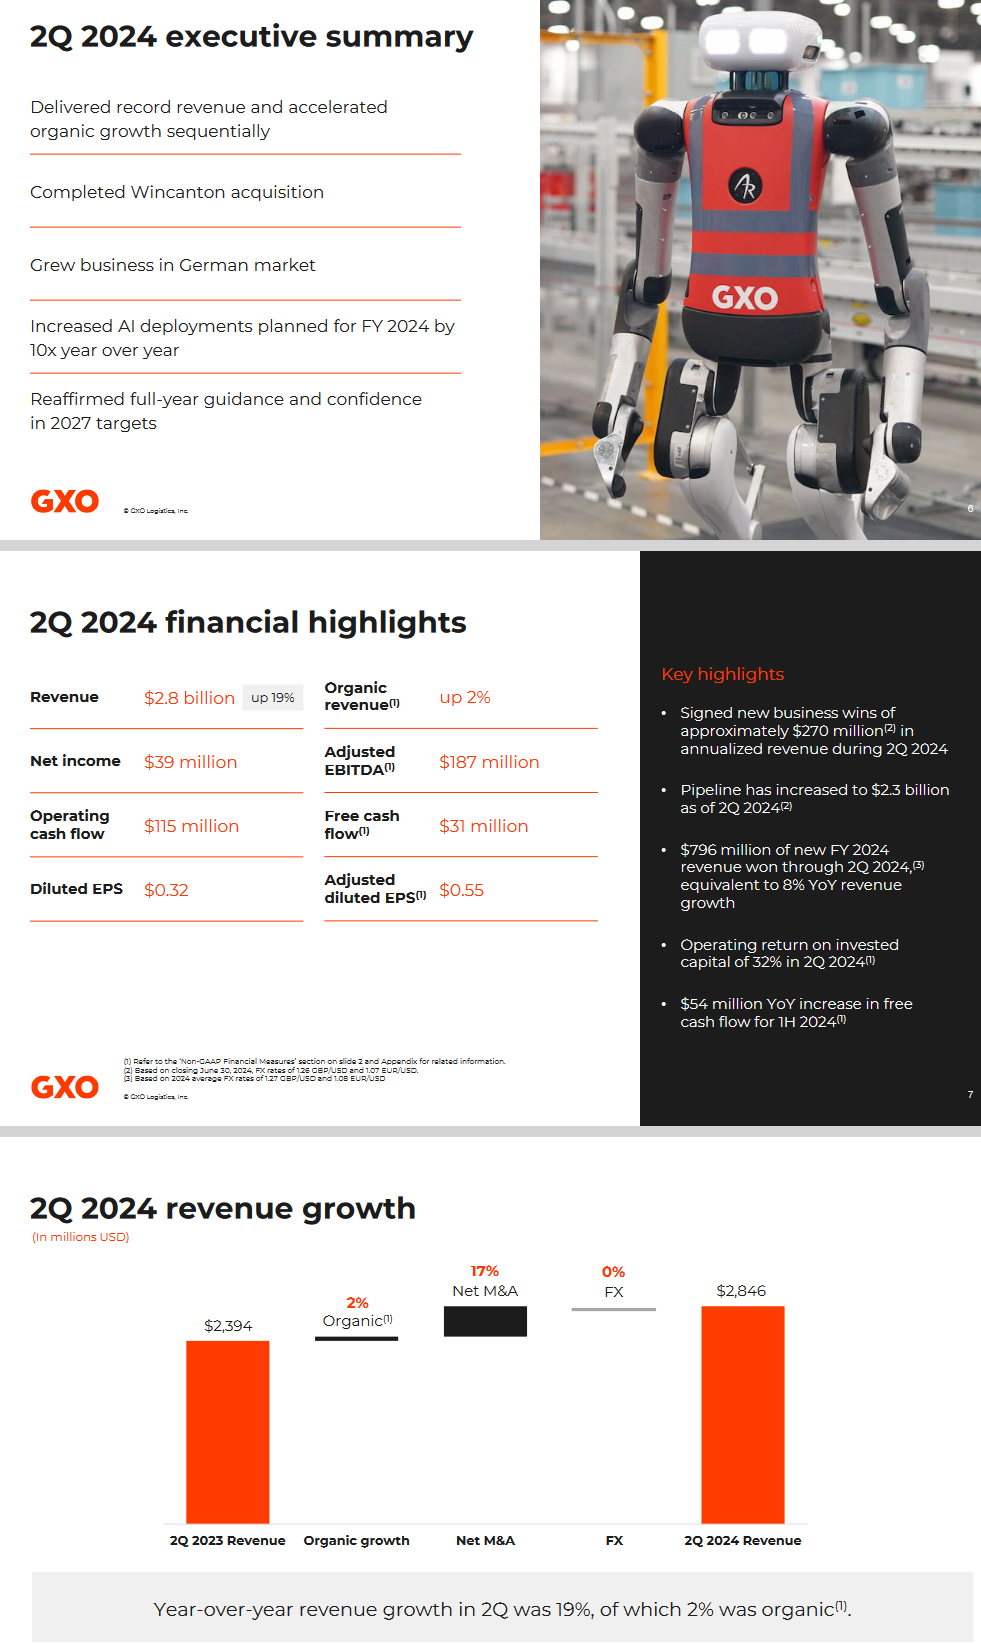
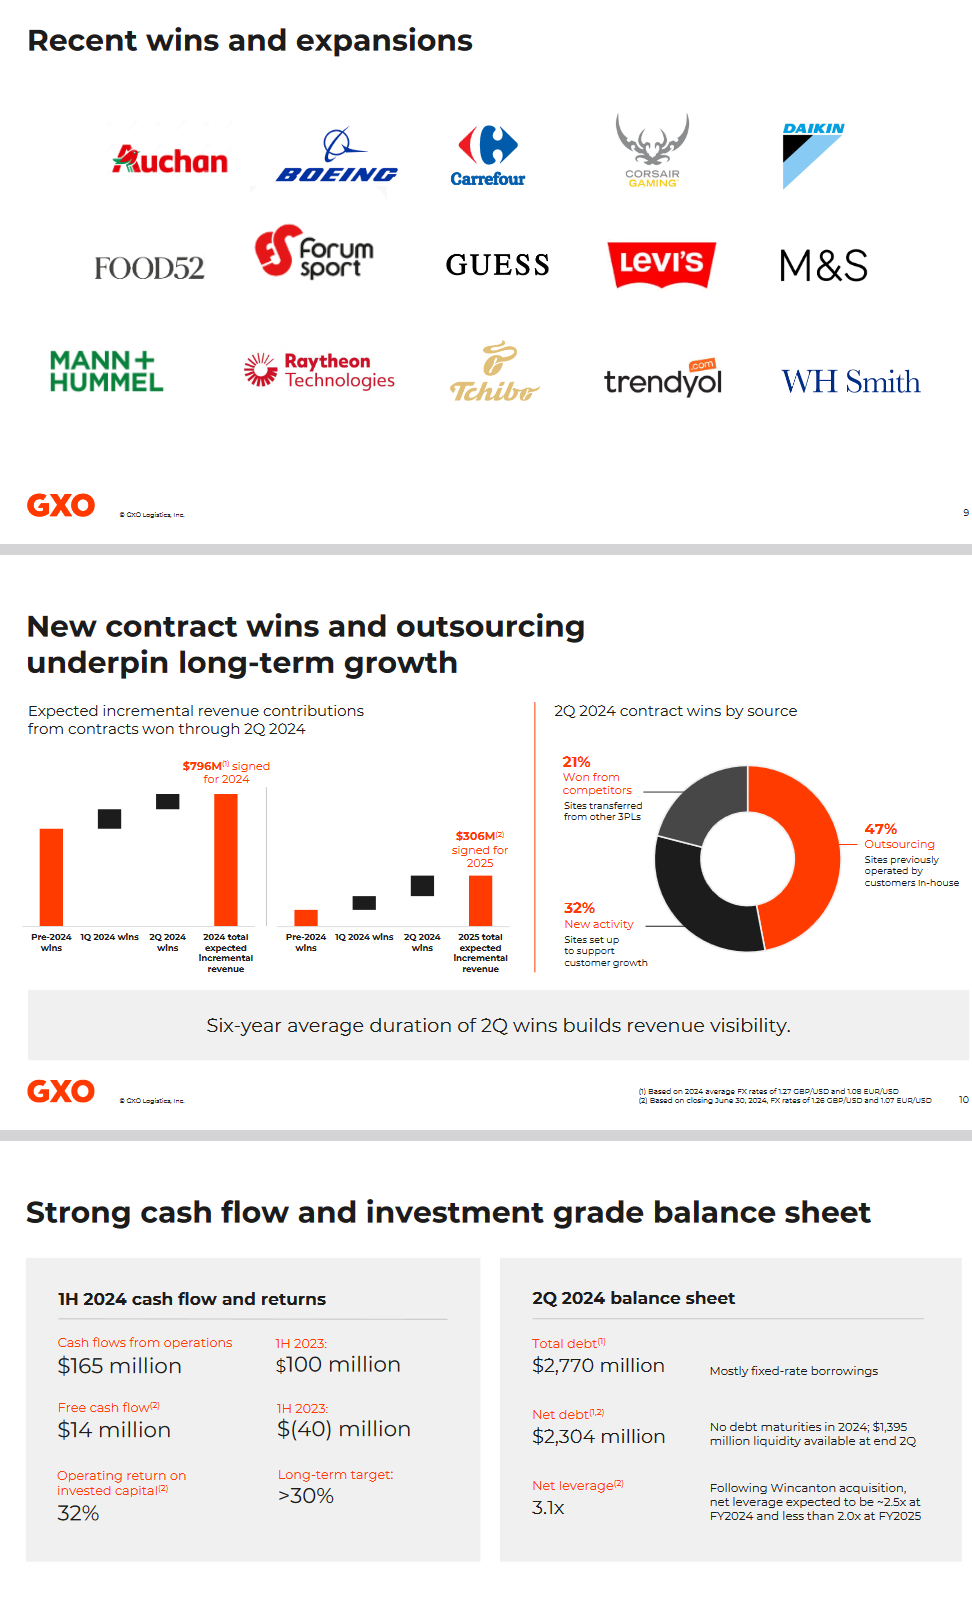
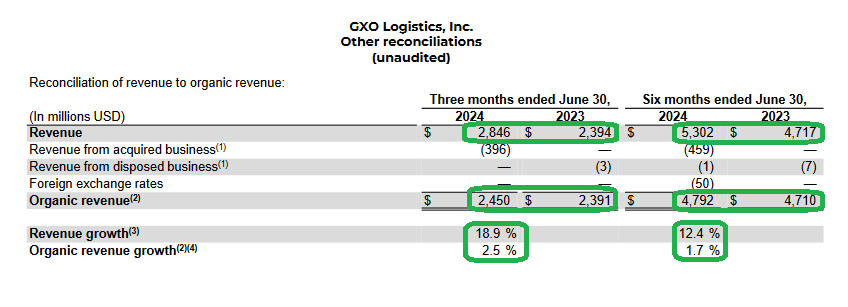
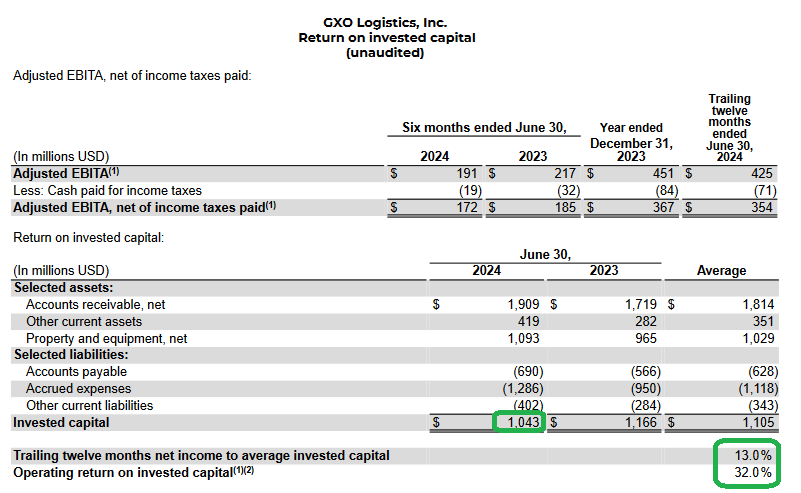
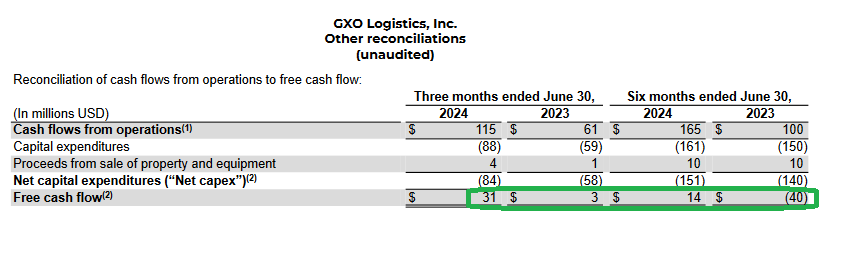
GXO Logistics Update
GXO reported earnings about a week ago. Here are the key points:
Now onto the shorter term view for the General Market:
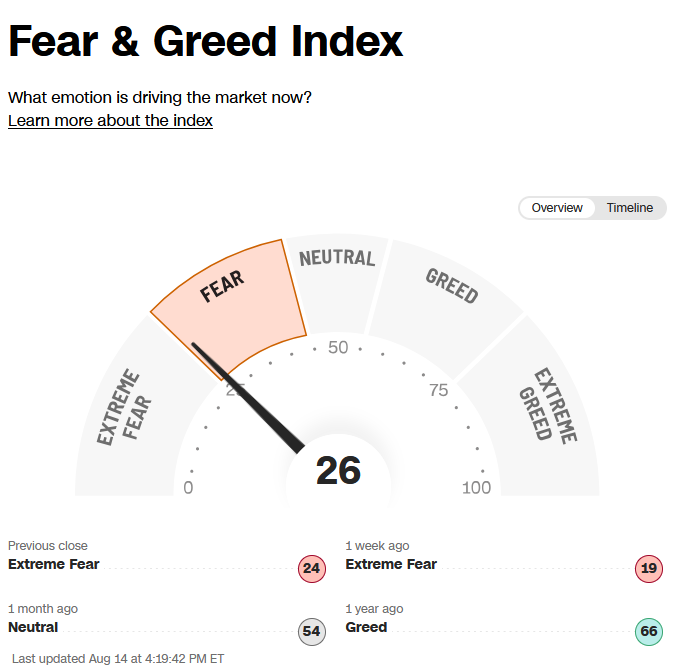
The CNN “Fear and Greed” ticked up from 21 last week to 26 this week. You can learn how this indicator is calculated and how it works here: (Video Explanation)
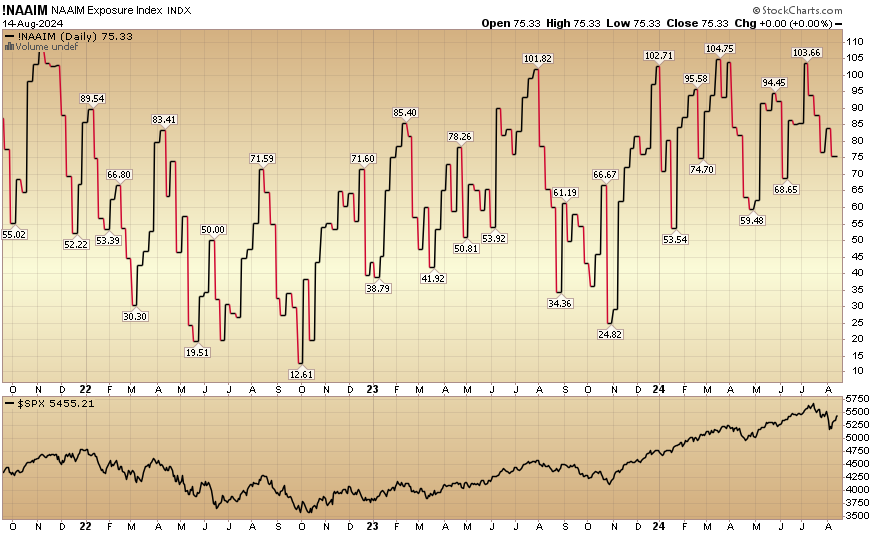
The NAAIM (National Association of Active Investment Managers Index) (Video Explanation) moved down to 75.33% this week from 83.93% equity exposure last week.
More By This Author:
“Like A Phoenix From The Ashes” Stock Market (And Sentiment Results)
“Pals, Trowels And Towels” Stock Market (And Sentiment Results)
Is It Time Yet? Stock Market (And Sentiment Results)


Comments
Log in or sign up to join the conversation.