

Image Source: Unsplash
Quantum computing enterprises IonQ (IONQ) and Rigetti (RGTI) have both witnessed blistering performances, with the former gaining 42% on a year-to-date basis and the latter swinging up a remarkable 177% during the same frame. However, their recent sessions have been incredibly volatile, raising concerns for would-be speculators.
In the trailing five sessions, IONQ stock is down about 26%, while RGTI is just a tad worse at over 27% down. At first glance, it would seem that the downturn would give those who were previously on the sidelines a chance to jump on the bandwagon at a relative discount. However, from the angle of technical analysis, the concern is that the price action could correct down to “natural” support lines.
For RGTI stock, that would be approximately $15, while for IONQ, this level would be $40. Given the comparison, Rigetti shareholders would have the most to lose. However, technical analysis is vulnerable to flawed interpretations as both the premise and the conclusion are contingent on the individual making the claim. As such, the approach is ego-driven, which is fine if the asserting analyst is on fire.
The problem, of course, is that investors have no idea when these hot streaks materialize — and when they end.
A more objective approach is quantitative analysis, the study of actual pricing behaviors to develop probabilistic projections. In IonQ’s case, its 10-week projected returns form a skewed standard distribution, with median price clustering occurring most prominently at approximately $57.50 (assuming an anchor price of $59.19).
(Click on image to enlarge)
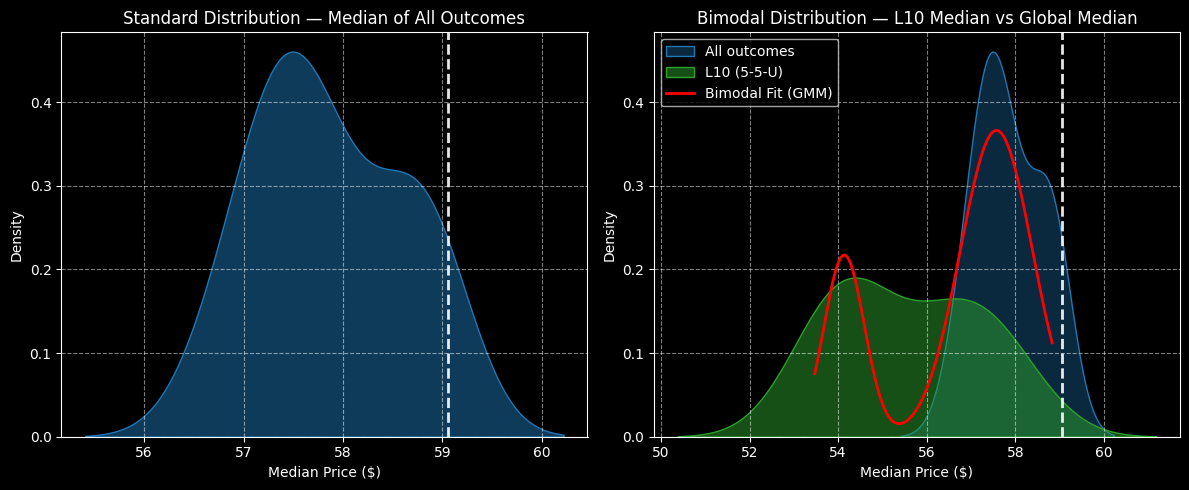
In the trailing 10-weeks, IONQ stock is structured in a 5-5-U sequence: five up and down weeks, with an overall upward trajectory. Probabilistically, the resultant bimodal distribution relative to the parent dataset pushes the price density further into the red at around $54.50.
On the other end, the standard distribution of RGTI stock features a more traditional-looking bell curve, with price clustering prominent at around $39 (assuming an anchor price of $41.98). What’s more, RGTI is currently structured in a 6-4-U sequence. Under this condition, price clustering improves to approximately $41.
(Click on image to enlarge)
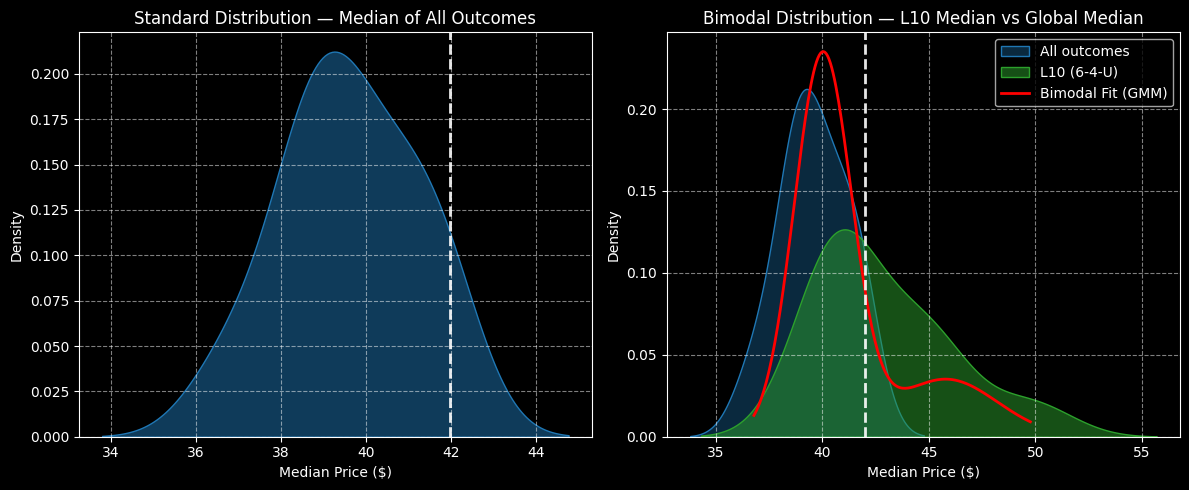
Admittedly, that’s still lower than the anchor. However, under 6-4-U conditions, the 10-week exceedance ratio (profitability rate) is 55.6%. That’s favorable compared to the baseline exceedance ratio of 39.8%.
To be clear, neither quantum computing stock stands out as a must-buy opportunity from a statistical standpoint. Still, when crunching the numbers relative to each other, RGTI stock has the empirical edge.
More By This Author:
Here’s The Science Behind Apple’s Persistent Rise Higher
Uranium Energy Might Be Overbought But Watch This Signal Closely
Why The Next Move Out Of The Dip Could Take QBTS Stock To $60


Comments
Log in or sign up to join the conversation.