
A simple game I used to like playing as a kid was spot the difference.
It is not unusual for LICs to play their own version of the game.
Firstly the pic below will bring back some memories of the game in case you have forgotten.

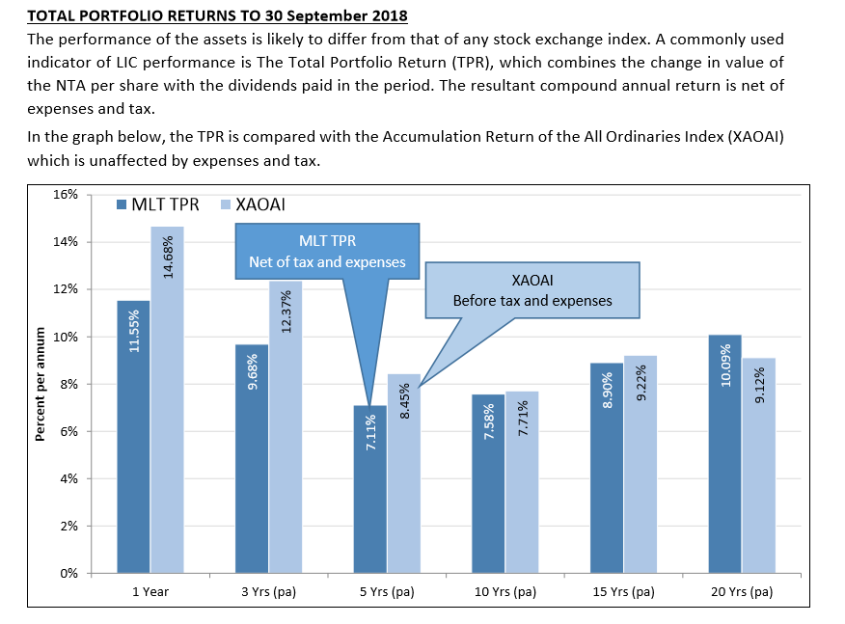
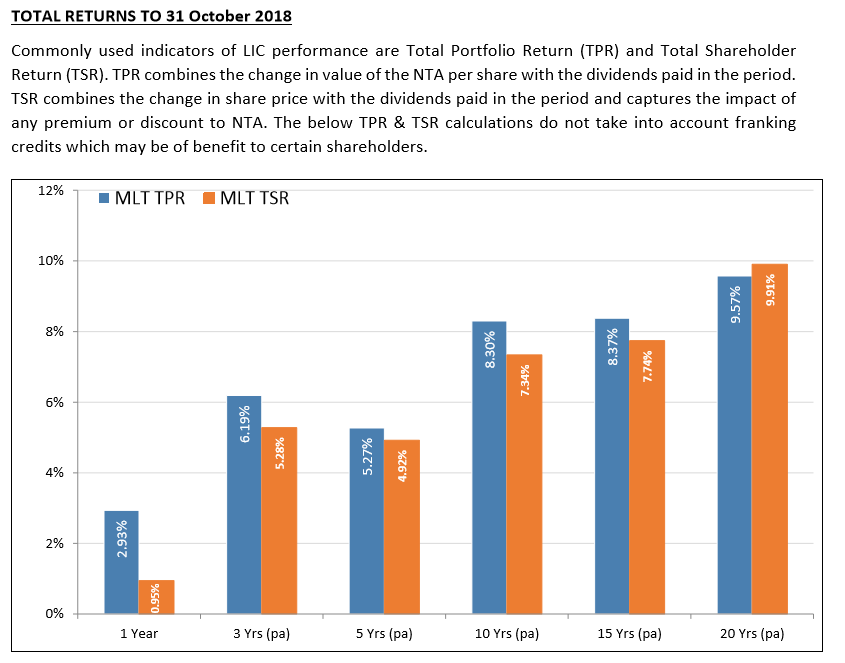
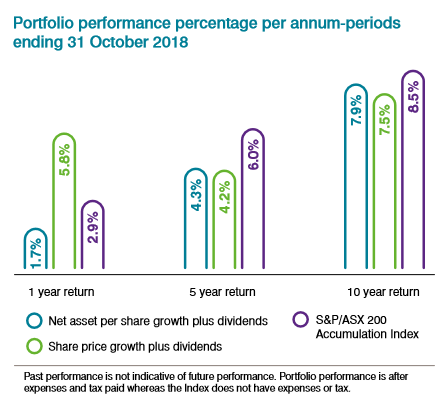
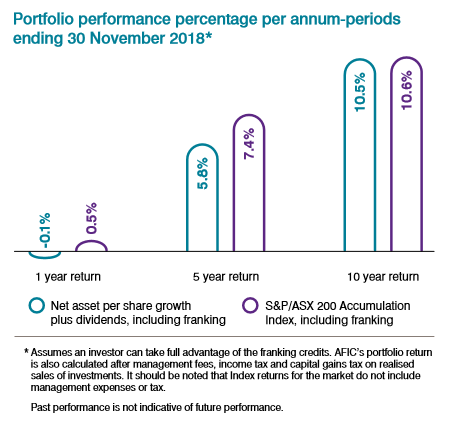
Let’s just say that are certain times fund managers like displaying their NTA returns against the indices, and certain times they don’t. Then there are certain times some feel the need to compare returns including the advantage of franking credits.
Below I have plucked out a couple of LICs who recently slightly changed the format of their regular monthly NTA reports.
NTA Report as at end September 2018
(Click on image to enlarge)
Same LIC’s NTA Report as at end October 2018
Another LIC’s NTA Report as at end October 2018
Same LIC’s NTA Report as at end November 2018
I thought this can be a useful post to sit here, and if readers find other examples they can point them out in the comments section throughout 2019. I suspect we will see more creative changes to various monthly NTA reporting formats as the year progresses.
Some will wonder why I have picked out these 2 examples, which happen to be a couple of the most trustworthy LICs I know out there. It is because if we have to examine their performance reporting with a fine tooth comb on occasions to see how they are going, what can we expect from the other 100 plus LICs out there? Remember there are no standardised regulated performance reporting when it comes to LICs.
With the examples above I don’t think there is anything necessarily wrong about how they are presenting their performance numbers with their new formatting. I would prefer to see consistency though whatever the LIC chooses, stick with the same method. It could be a sign however they are feeling a bit under pressure from their numbers versus the benchmark over the last 5 years. Also to some extent regarding their nominal returns. To their credit the current format is still presenting their own numbers net of fees, so they are well ahead of many other LICs in terms of integrity of reporting.
With some LICs I even struggle to locate the performance numbers at all. If you can find CAM & FPC quoting their own since inception numbers then let me know. I would like to think someone can dig them up and I can edit this part of the post, perhaps my eyesight is failing me. Trying to find the performance since inception numbers for some LICs reminded me of another picture style game I enjoyed as a child. That was trying to find the hook in the Jeff Hook cartoons. Like finding the hook, I spent ages trying to find performance returns since inception with certain LICs but are often still searching.

The performance reporting table for other LICs appear to play games that give me a laugh at times. Take FSI for instance. Gross before fees, taxes and charges for the portfolio numbers. Then the comparison numbers you can take your pick. The bank bill index, or the All Ordinaries Index (i.e. not counting the dividends). I would certainly hope the portfolio beats those over the long term! KAT is another LIC that displays its portfolio outperformance (on their gross returns) over the All Ordinaries Index (not accumulation index, i.e. again not counting the dividends in the index measure).
Please feel free to share in the comments any other amusing performance reporting games you find in the LIC space.
IT’S TIME TO REVIEW VARIOUS FUND REPORTING COME MID JANUARY
When I last made a blog post in mid-December I mentioned that I was a little uncertain whether a lot of the performance reporting in recent times did a good job reflecting fund manager skill. I felt this way because the largest market in the world had enjoyed a relatively uninterrupted bull run for a decade. Normally looking back a decade captures a cycle including a recession and a bear market. This was not the case a couple of months back, yet things have changed since.
With the heavy market slump in Q4 last year, we might be getting close to a good point in time to evaluate a fund manager’s performance. We can now say a fund manager’s 5 and 10 year return numbers include a mix of different markets, bullish and somewhat bearish as we closed out 2018.
I encourage readers to take a fresh look come mid-January at the longer term returns, if you can find them of course. Pay attention to the fine print regarding before or after expenses, costs etc. Are they using NTA or share price, are they grossing up returns for franking? Has the marketing department decided to use a fresh approach in 2019 to the formatting that is coincidentally kinder to the look of overall return numbers displayed?
It wouldn’t shock me to see a small cap manager suddenly reference the ASX emerging companies index, after previously comparing itself to the ASX200. It has been very tough in 2018 for smaller companies.
Other numbers I will personally be looking to see some updates soon are global CAPE ratios. I don’t think they are some magic tool for market timing. I do believe they can be handy stats to have in the back of your mind when considering where in the world to search for some value. Assuming like myself you often invest with a very long term mindset.
Perhaps these updated CAPE numbers will now look less worrying than a year ago. With markets having experienced a bit of a shakeout I am comfortable carrying more normal cash levels in my portfolio. A year ago I remember discussing some nervousness surrounding some rapid rises in bitcoin, emerging market stocks, FANG stocks, and even some of the riskier “thematic” stocks on the ASX. 2018 saw a healthy reality check in deflating the value of many such areas.
As a result I think there is a little less to worry about in markets in 2019. I would probably want the decline we have seen from market tops to be in the order of 25-30%, rather than around 10-15% across world equity markets currently though. Then I think I could start to get genuinely excited over a lot of new buying opportunities.


Comments
Log in or sign up to join the conversation.