
During yesterday's session, Pieris Pharmaceuticals (PIRS) soared in the financial markets after reaching a collaboration agreement with Genentech, in an operation that could be valued at $1.4 billion. This triggered its price by more than 103%, thus becoming one of the great protagonists of the session.
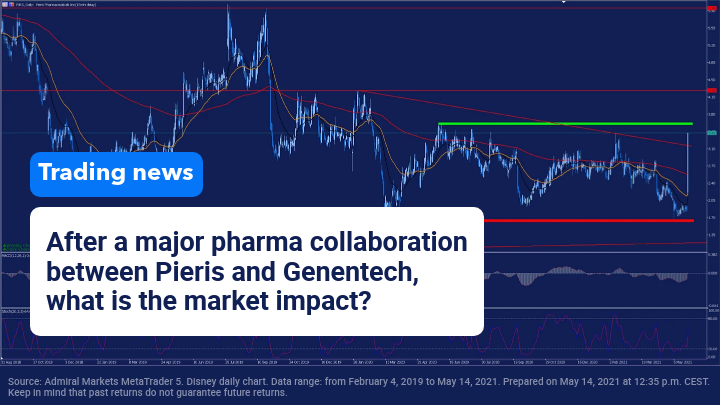
Specifically, this collaboration agreement focuses on several Genentech research programmes related to respiratory and ophthalmological problems that will use Pieris Pharmaceuticals' technology called Anticalin. In principle, Pieris will receive an initial payment of $20 million, although as we mentioned previously, this operation could reach $1.4 billion, depending on the results and objectives.
As we can see in the history of this company, during the last 5 years it has experienced strong volatility, although during the last months, the price has been trapped in a strong lateral range represented by the red and green bands that act as main levels of support and resistance.
After discovering the news yesterday, the price made a strong impulse from practically the lower band of this channel to exceed the medium-term downtrend line, closing at the highs of February 10 of this year at $3.42 per share in an area near the top of the canal.
This agreement can give the necessary momentum to this action to overcome said resistance level, so the breakdown of this would open the doors to a further upward journey to the level of $4.28, which acts as its second resistance.
On the other hand, after the strong momentum of yesterday's session, we cannot rule out a profit taking in the short term, which could cause a correction in the price in order to make a new impulse. Failure to break the upper band of the channel could prolong this important lateral movement over time.
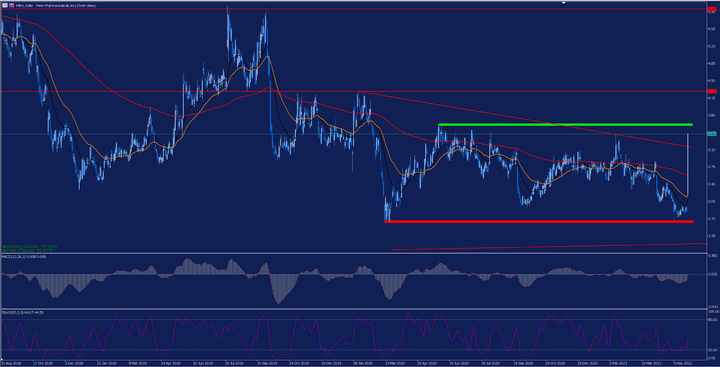
Source: Pieris Pharmaceuticals daily chart from Admiral Markets MetaTrader 5 platform from August 31, 2018 to May 26, 2021. Done: May 26 at 12:00 CEST. Note: Past performance is not a reliable indicator of future results, or future performance.
Evolution of the last 5 years:
- 2020: -30.94%
- 2019: 36.09%
- 2018: -64.77%
- 2017: 437.29%
- 2016: -38.64%


Comments
Log in or sign up to join the conversation.