
Options Pricing In Santa

Image Source: Unsplash
As we finish the last full trading week of the year today, questions are beginning to abound regarding the likelihood of a “Santa Claus rally”. The standard definition of its timeframe is the last five trading days at year-end and the first two trading days of the ensuing year.Although this year’s start date is the Christmas Eve half-day, as is typical, it seems that traders are revving up their sleighs in advance.
Yesterday’s rally seems to have abated the sour mood that prevailed earlier this week, and the good vibes are continuing today.In a change to the recent pattern, the pre-market was rather subdued.It was only once the regular session opened that stocks began their ascent in earnest.It’s not clear what created the early mood booster – perhaps there was some influence from the quarterly expiration of futures and options – but it has persisted in the hours since.
One way that we can discern traders’ optimism for Santa’s arrival is using the IBKR Probability Lab.It has become customary to see traders assign higher probabilities to above-market outcomes for the S&P 500 (SPX).We have posited that it might represent “FOMO insurance”, where skeptical or underinvested institutional investors utilize upside calls to hedge their risk of underperformance. Of course, it could simply be that after a three-year bull market traders simply expect that the market is more likely to rise than fall on any given day and over any given period.I suspect that both factors are at work.Regardless, the propensity for an asymmetric upside probability distribution certainly continues through to the Santa Claus rally period.
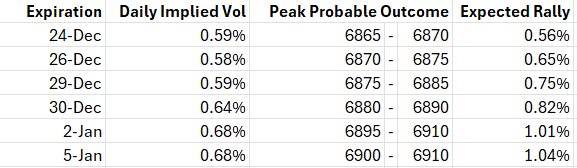
As you look through the charts below, you should notice two easily explainable patterns.The daily average implied volatilities (top right) tend to rise and so do the peak outcomes.(You may also notice that we don’t include December 31st.Frankly, I’m not sure why that data is not available.)
Regarding the implied volatilities, remember that the normal term structure of volatility rises over time, and that in this case, we are looking mainly at a period when volatility tends to be suppressed.As for the rising peak outcomes, if one expects the market to rise on Day 1, it is reasonable to use a higher starting point on Day 2.
Bottom line, traders are pricing in a modest rally into the end of the year and the start of next. Quite frankly, I was expecting a bit more optimism – perhaps even a run at 7,000.In any case, unless we get some significant market-moving news, the adage “don’t short a dull tape” should resonate with traders between now and year-end.
IBKR Probability Lab for SPX Options Expiring December 24, 2025
(Click on image to enlarge)
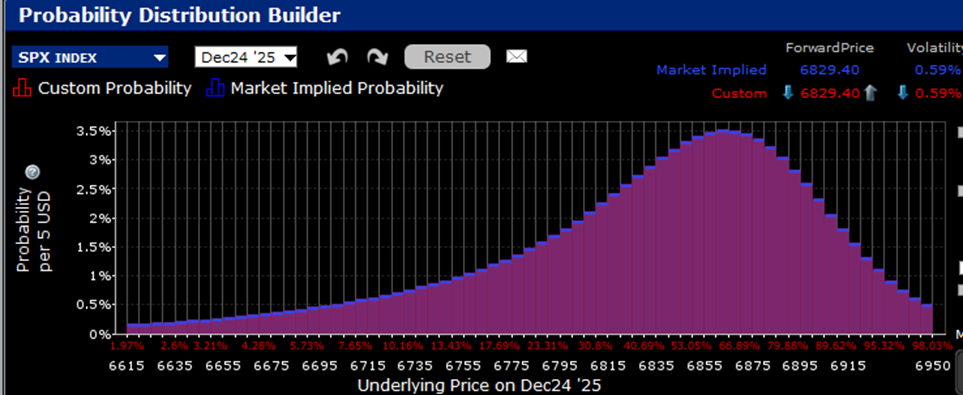
Source: Interactive Brokers
IBKR Probability Lab for SPX Options Expiring December 26, 2025
(Click on image to enlarge)
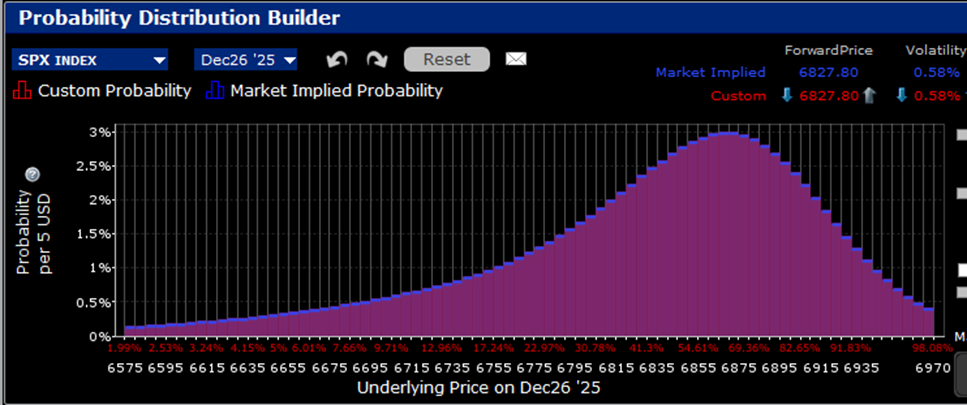
Source: Interactive Brokers
IBKR Probability Lab for SPX Options Expiring December 29, 2025
(Click on image to enlarge)

Source: Interactive Brokers
IBKR Probability Lab for SPX Options Expiring December 30, 2025
(Click on image to enlarge)
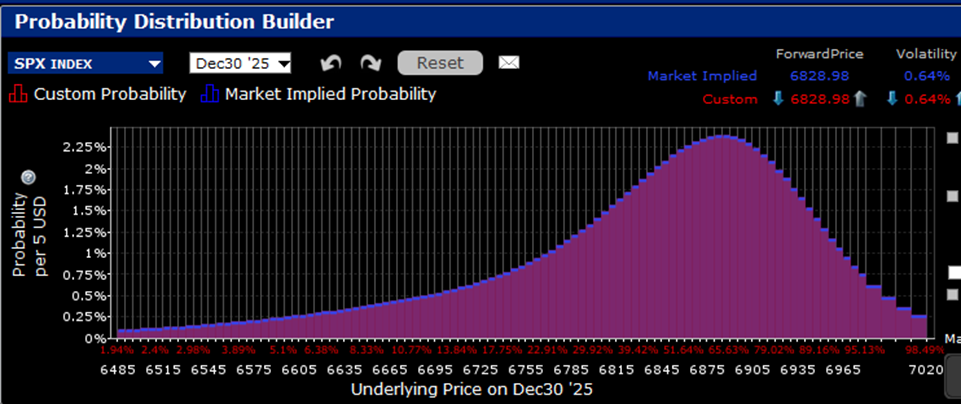
Source: Interactive Brokers
IBKR Probability Lab for SPX Options Expiring January 2, 2026
(Click on image to enlarge)
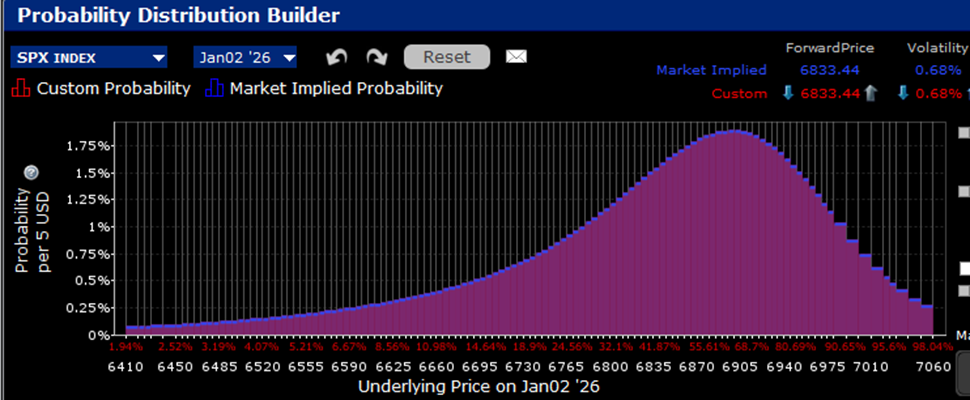
Source: Interactive Brokers
IBKR Probability Lab for SPX Options Expiring January 5, 2026
(Click on image to enlarge)

Source: Interactive Brokers
More By This Author:
CPI + MU = Relief Today
“Bluto Rallies” Punctuate The Market
Mr. Market Battles A Case Of The Blahs
Disclosure: Options Trading
Options involve risk and are not suitable for all investors. For information on the uses and risks of options, you can obtain a copy of the Options Clearing ...
more

