Nvidia Corp. Stocks Elliott Wave Technical Analysis - Monday, January 6
NVDA Elliott Wave Analysis Trading Lounge
NVIDIA Corp., (NVDA) Daily Chart
NVDA Elliott Wave Technical Analysis
FUNCTION: Trend
MODE: Impulsive
STRUCTURE: Motive
POSITION: Minor wave 3
DIRECTION: Upside in 3 of (5).
DETAILS: We are looking at the resumption of the uptrend into wave (5). We are trading slightly below MediumLevel at 150$, looking for support on top of that to confirm the bullish bias.
(Click on image to enlarge)
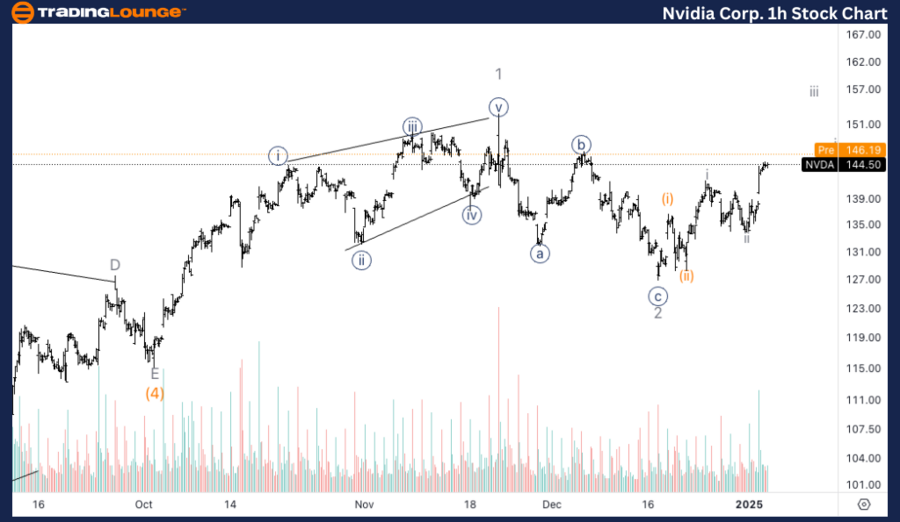
NVIDIA Corp., (NVDA) 1H Chart
NVDA Elliott Wave Technical Analysis
FUNCTION: Trend
MODE: Impulsive
STRUCTURE: Motive
POSITION: Wave (iii) of {i}.
DIRECTION: Upside into wave (iii).
DETAILS: Looking for a couple of ones-twos within wave {i} to break through 150$. The next pullback will be crucial as it shall not cross with wave i.
(Click on image to enlarge)
This Elliott Wave analysis for NVIDIA Corp., (NVDA) examines both the daily and 1-hour charts to assess its current market trend, utilizing Elliott Wave Theory to anticipate potential future movements.
* NVDA Elliott Wave Technical Analysis – Daily Chart*
On the daily chart, NVIDIA is currently in Minor wave 3 of the larger wave (5). The uptrend is expected to continue as we look for support around MediumLevel 150$. A successful hold and bounce from this level would confirm the bullish bias and suggest the resumption of the rally toward higher levels. Breaking above 150$ and sustaining above this level would provide further confirmation of the uptrend continuing into wave (5).
* NVDA Elliott Wave Technical Analysis – 1H Chart*
The 1-hour chart suggests the development of wave (iii) of {i} within the larger impulsive structure. NVIDIA is likely building momentum with a series of ones and twos (internal wave subdivisions) within wave {i} to break through 150$. The next pullback will be crucial, and it must not retrace into the territory of wave i to maintain the integrity of the impulsive move. A break above 150$ with strong momentum would indicate further upside in wave (iii).
More By This Author:
Dogecoin Crypto Price News Today Elliott Wave Technical Analysis 9
Unlocking ASX Trading Success: Car Group Limited
Elliott Wave Technical Analysis - Advanced Micro Devices Inc.
Analyst Peter Mathers TradingLounge™ Australian Financial Services Licence - AFSL 317817

.thumb.png.96d41ba9673627b9f9fae447f70642f1.png)


