

In this technical blog, we will look at the past performance of the 4-hour Elliott Wave Charts of Nike ticker symbol: $NKE. We presented to members at the elliottwave-forecast. In which, the decline from 01 October 2024 unfolded as an impulse structure. And showed a lower low favored more downside extension to take place. Therefore, we advised members not to buy the stock & sell the bounce in 3, 7, or 11 swings. Based on Elliott wave hedging area looking to get 3 wave reaction lower at least. We will explain the structure & forecast below:
Nike 4-Hour Elliott Wave Chart From 12.19.2024
(Click on image to enlarge)
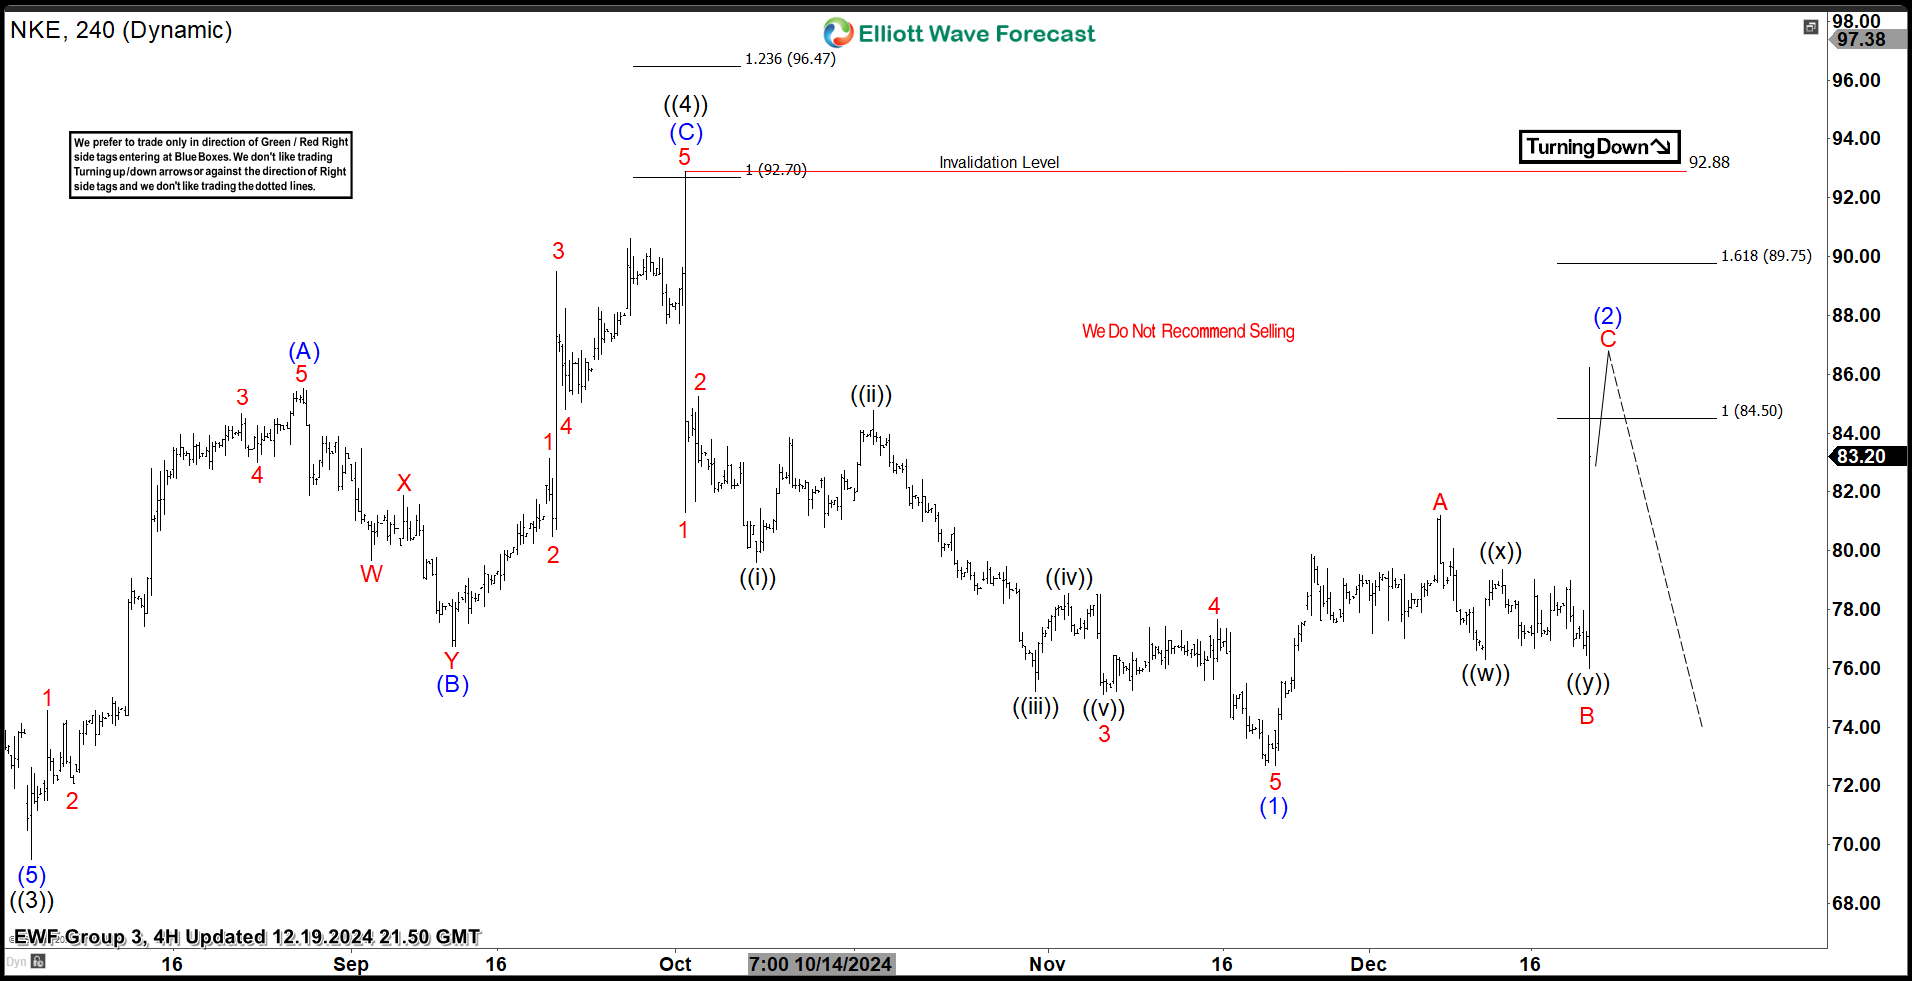
Here’s the 4-hour Elliott wave chart from the 12.19.2024 update. In which, the cycle from the 01 October ended in wave (1) as an impulse structure at $72.70 low. Up from there, the stock made a bounce higher in wave (2) to correct that cycle. The internals of that pullback unfolded as Elliott wave zigzag structure where wave A ended at $81.18 high. Wave B pullback ended at $76.31 and wave C managed to reach the elliott wave hedging area at $84.50- $89.75 area. From there, market makers agrees for the minimum reaction lower to take place.
Nike Latest 4-Hour Elliott Wave Chart From 12.29.2024
(Click on image to enlarge)
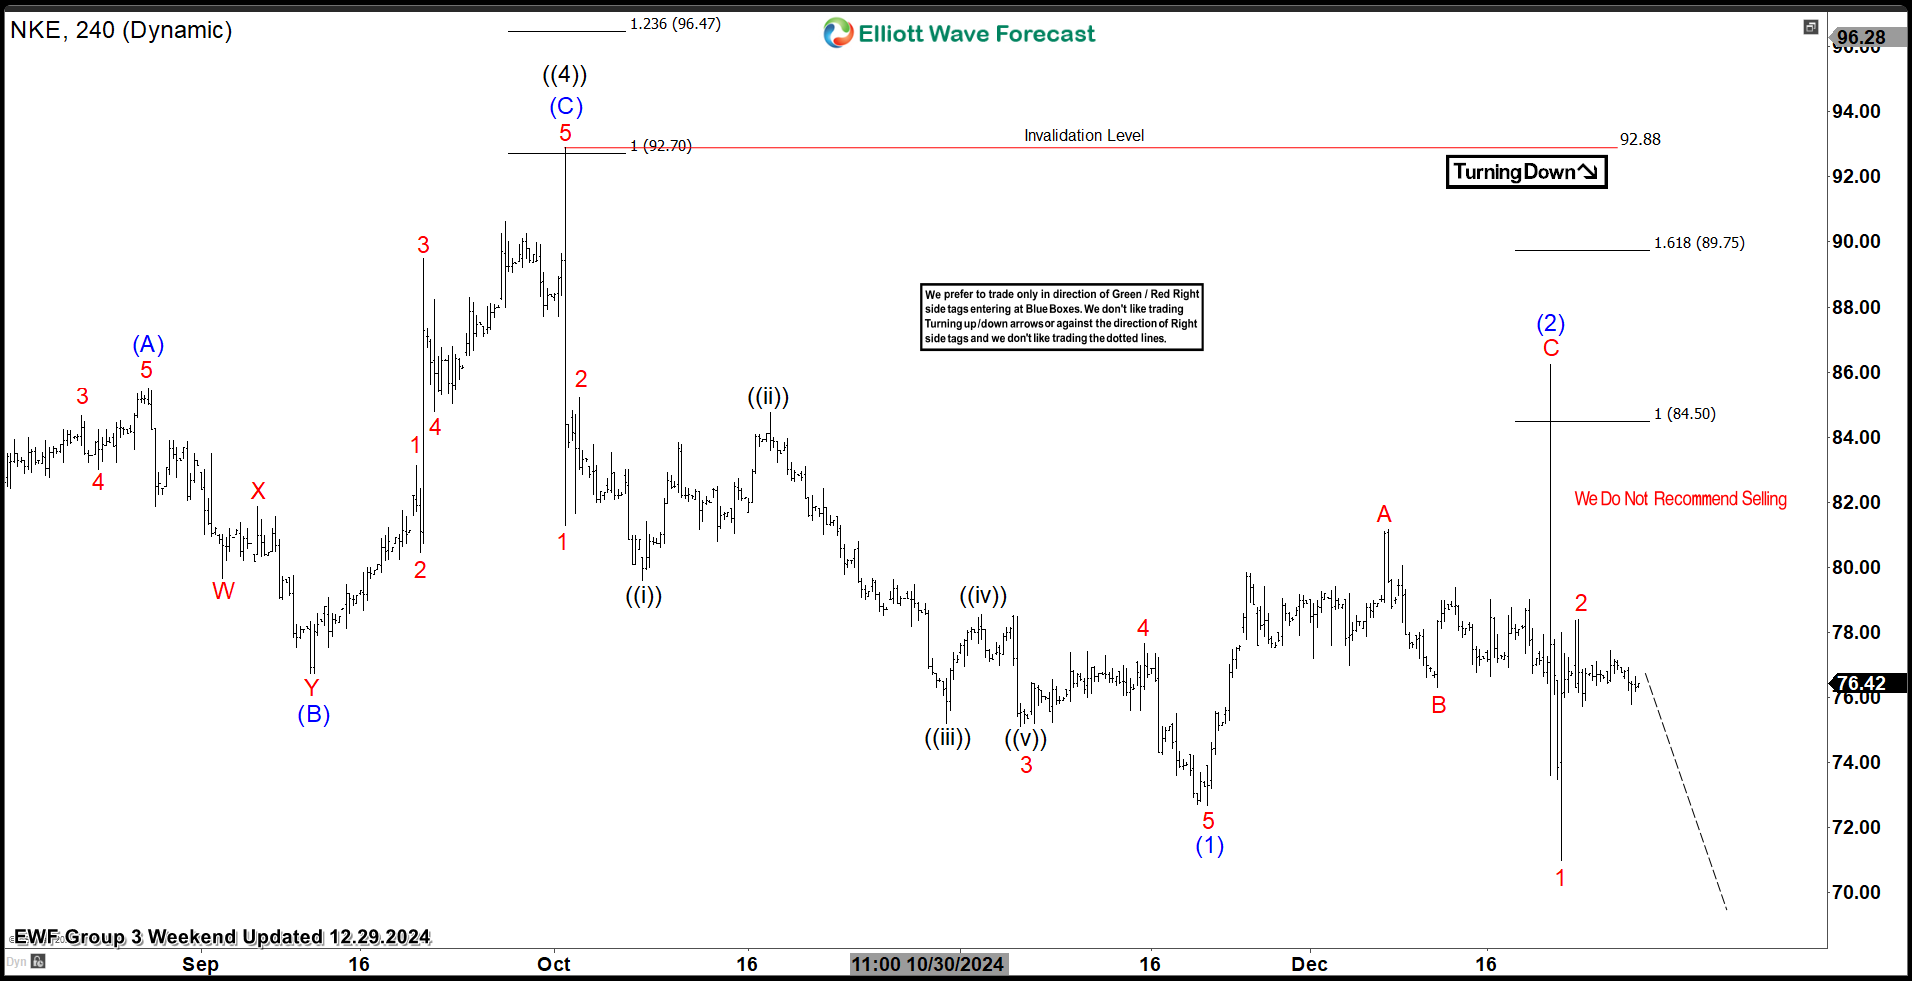
This is the latest 4-hour Elliott wave Chart update. In which the Nike is showing a strong reaction lower taking place, right after ending the zigzag correction within the equal legs area. Allowed members to create a risk-free position shortly after taking the long position. Since then, the stock has made a new low below $72.70 low confirming the next extension lower towards $66.05- $61.29 area lower before next bounce takes place.
More By This Author:
ETHUSD Buying The Dips After Elliott Wave Double ThreeNetflix Buying The Dips At The Blue Box Area
Netflix Is In Process Of Doing Five Waves Advance


Comments
Log in or sign up to join the conversation.