Sunday, November 6, 2022 12:04 PM EST
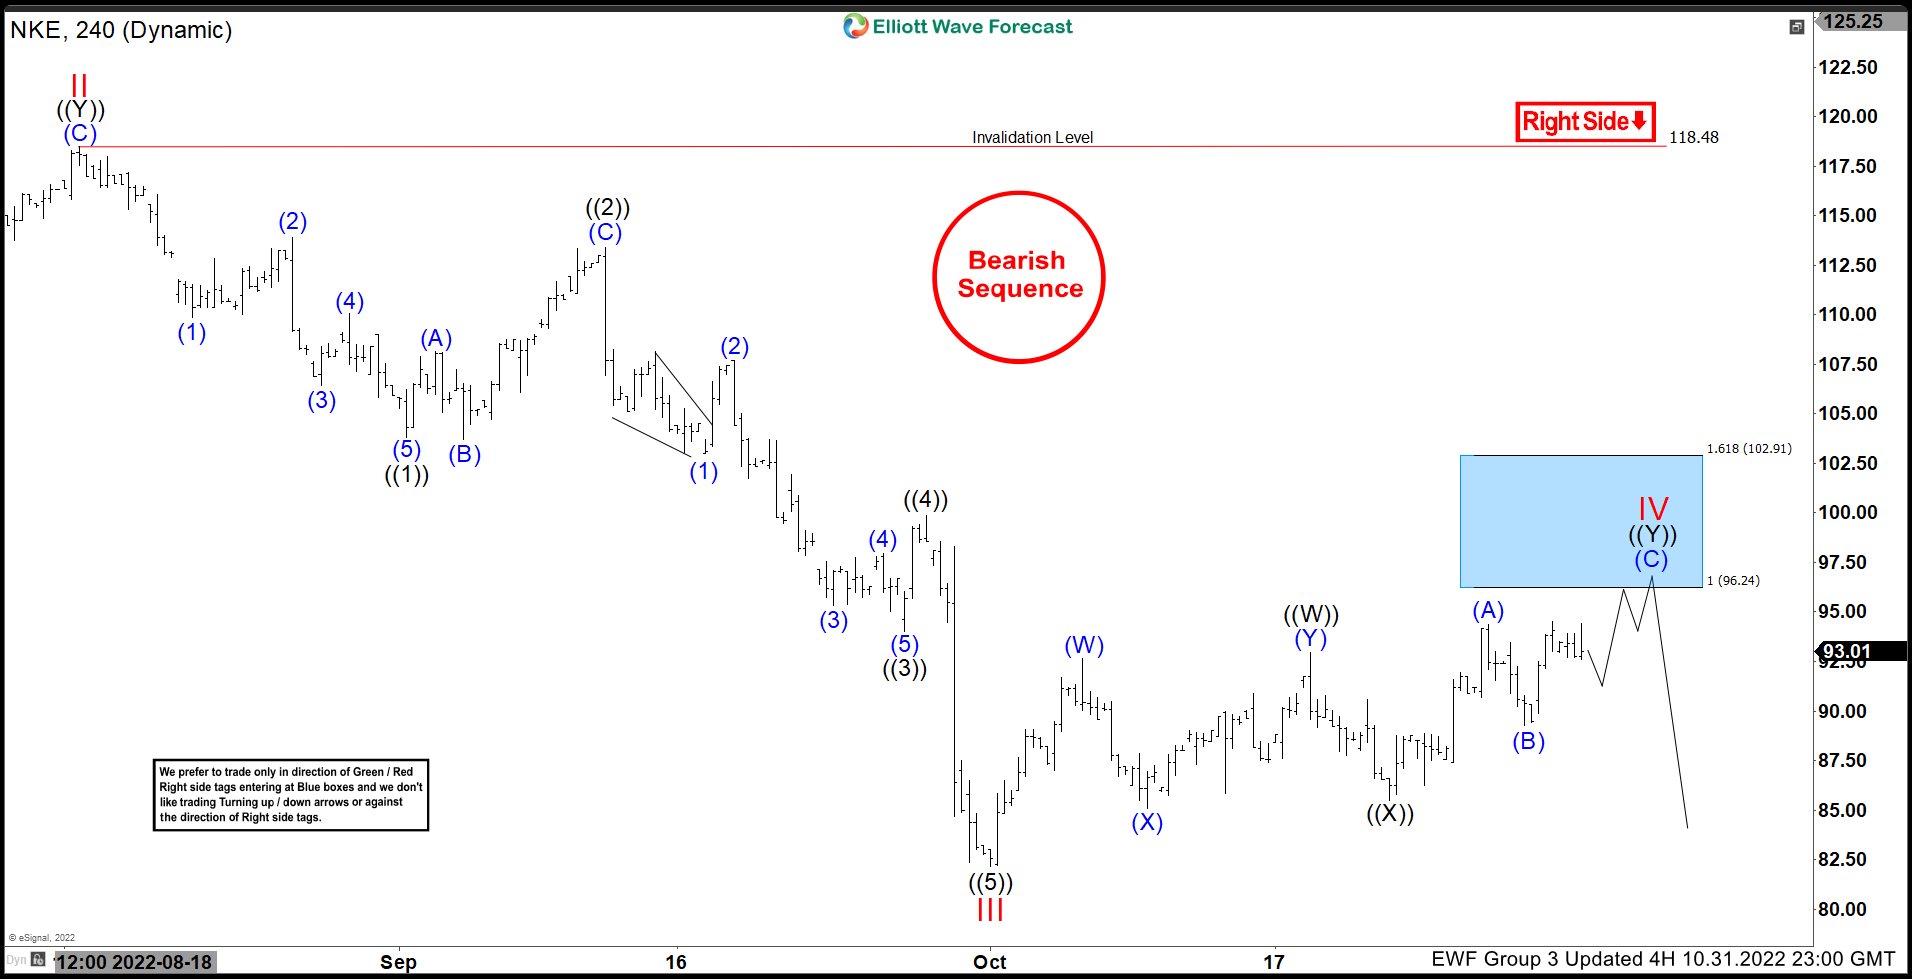
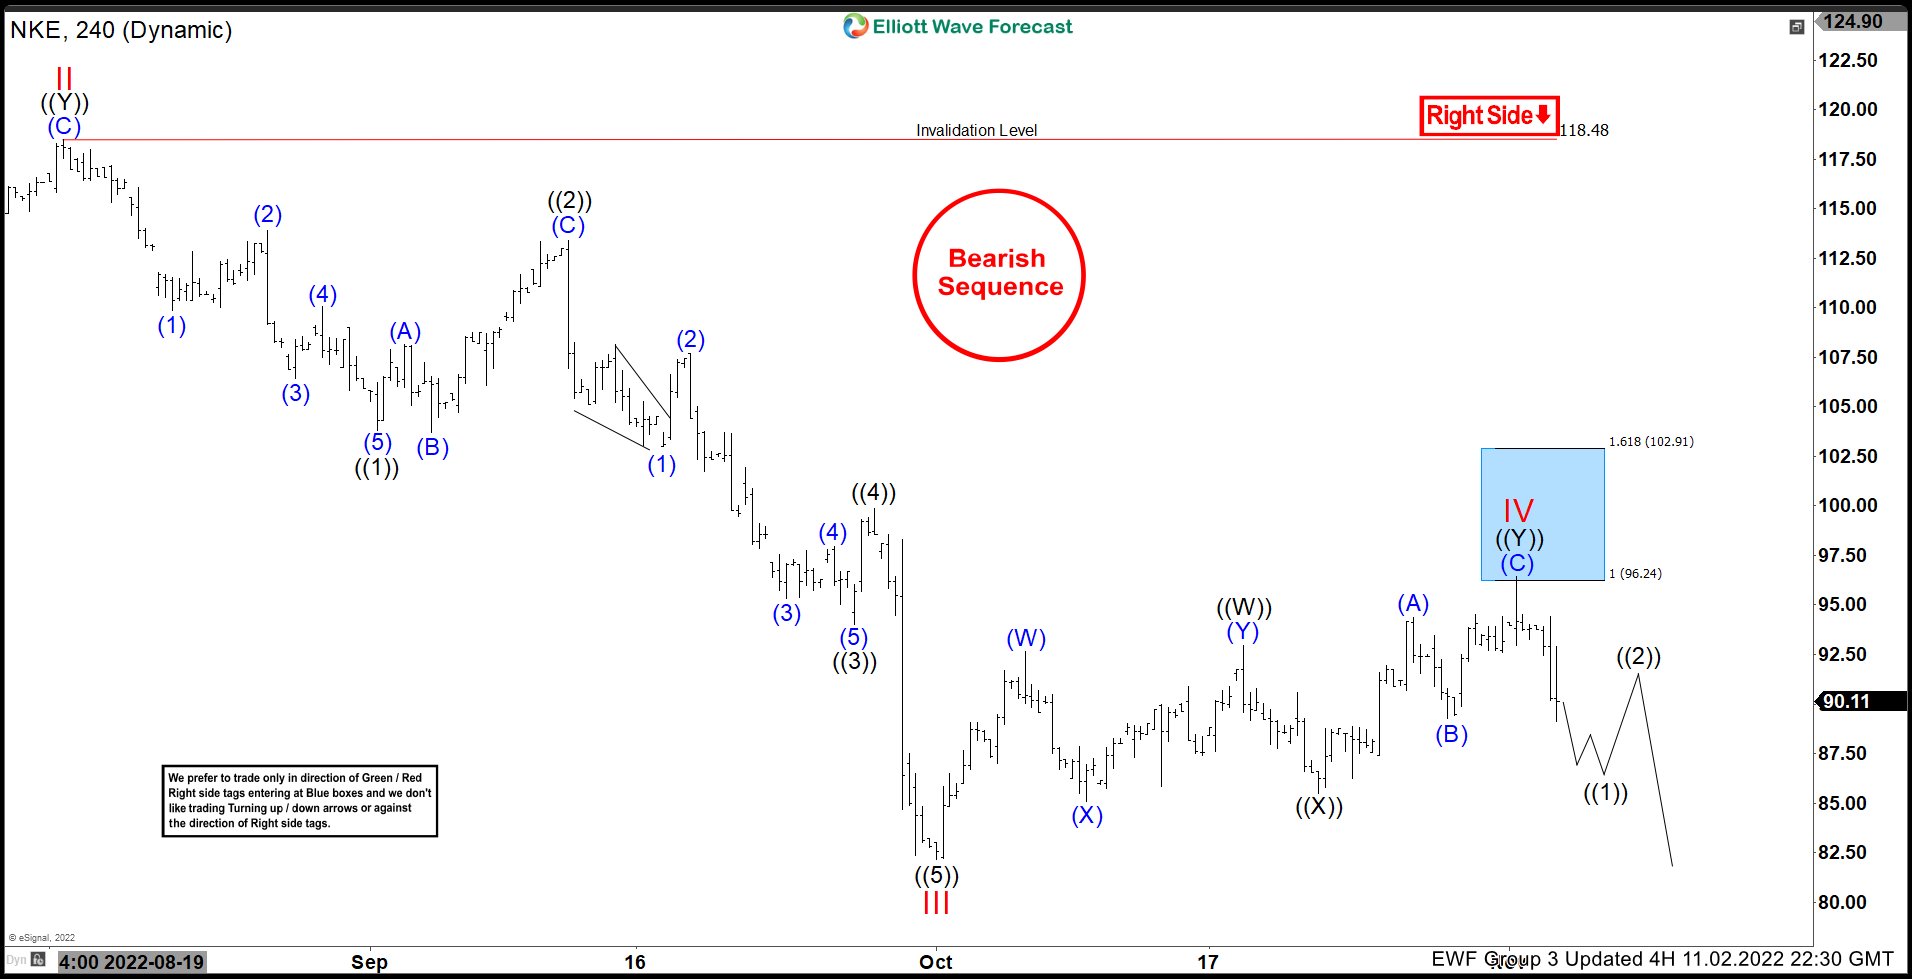
Good day Traders and Investors. In today’s article, we will look at the past performance of 4 Hour Elliottwave chart of Nike Inc. (NKE). The decline from 08.16.2022 high unfolded as 5 swings which created a bearish sequence in the 4H timeframe. Therefore, we knew that the structure in $NKE is incomplete to the downside & should see more weakness in 3 or 7 swings against 08.16.2022 peak. So, we advised members to sell the bounces in 3, 7, or 11 swings at the blue box area. We will explain the structure & forecast below:
$NKE 4H Elliottwave Chart 10.31.2022:
(Click on image to enlarge)

Here is the 4H Elliottwave count from 10.31.2022. The decline from 08.16.2022 unfolded in 5 waves breaking below 07.01.2022 low creating a bearish sequence. We were calling for the bounce to fail in 7 swings at black ((Y)) of IV where we like to sell it at the equal legs at $96.24 with a stop at $102.91.
$NKE Latest Elliottwave Chart:
(Click on image to enlarge)

Here is the 11.02.2022 4H update showing the move taking place as expected. The stock has reacted lower from the blue box to reach the 50% back from black ((X)) allowing any shorts to get risk free shortly after taking the position.
More By This Author:
USDCAD Elliott Wave: Buying The Dips At The Blue Box AreaElliott Wave View: Dollar Index (DXY) Has Resumed HigherGDXJ Looking To Form Bottom
Disclaimer: InvestingHaven.com makes every effort to ensure that the information provided is complete, correct, accurate and ...
more
Disclaimer: InvestingHaven.com makes every effort to ensure that the information provided is complete, correct, accurate and updated.In spite of these efforts, errors may occur in the information provided.If the information provided contains errors or if certain information is not available on or via the site, InvestingHaven.com will make every effort to rectify the situation as soon as possible. However, InvestingHaven.com cannot be held liable for direct or indirect damages resulting from the use of the information on this site. If you notice any errors in the information provided via the site, please contact the manager of the site.
Moreover, the views expressed in the articles (posts) on this website are the ones from the authors and are for information only. It is not intended as an offer, invitation, or solicitation to buy or sell any of any security or asset described. Nor the website manager nor the authors do accept any liability whatsoever for any direct or consequential loss arising from the use of their content. Please consult a qualified financial advisor before making investments. The information on this website and in the articles (posts) is believed to be reliable , but the authors do not make any representations as to its accuracy or completeness.
The content of the site (including links) may be adjusted, changed or expanded at any time without notice. InvestingHaven.com does not guarantee the proper functioning of the website and cannot be held liable in any way for the improper functioning or temporary (un)availability of the website or for any form of damage, direct or indirect, which may be the result of access to or use of the website.
InvestingHaven.com cannot be held liable under any circumstances by anyone, directly or indirectly, in any specific or other way, for damages resulting from the use of this site or any other site connected by means of links or hyperlinks, including, without limitation, any losses, interruptions of work, damage to programmes or other information on the computer system or to equipment, software or other items owned by the user.
less
How did you like this article? Let us know so we can better customize your reading experience.


