Nasdaq Teetering On Important Fibonacci Price Support
(Click on image to enlarge)

Technology has become a durable and leading sector or the global economy and stock markets.
And due to a concoction of mixed economic data, over-heated inflation, and rising interest rates technology stocks have been caught in the cross-hairs of a bear market.
Today, we turn to Joe Friday for, “The Facts, Ma’am. Just the facts.”
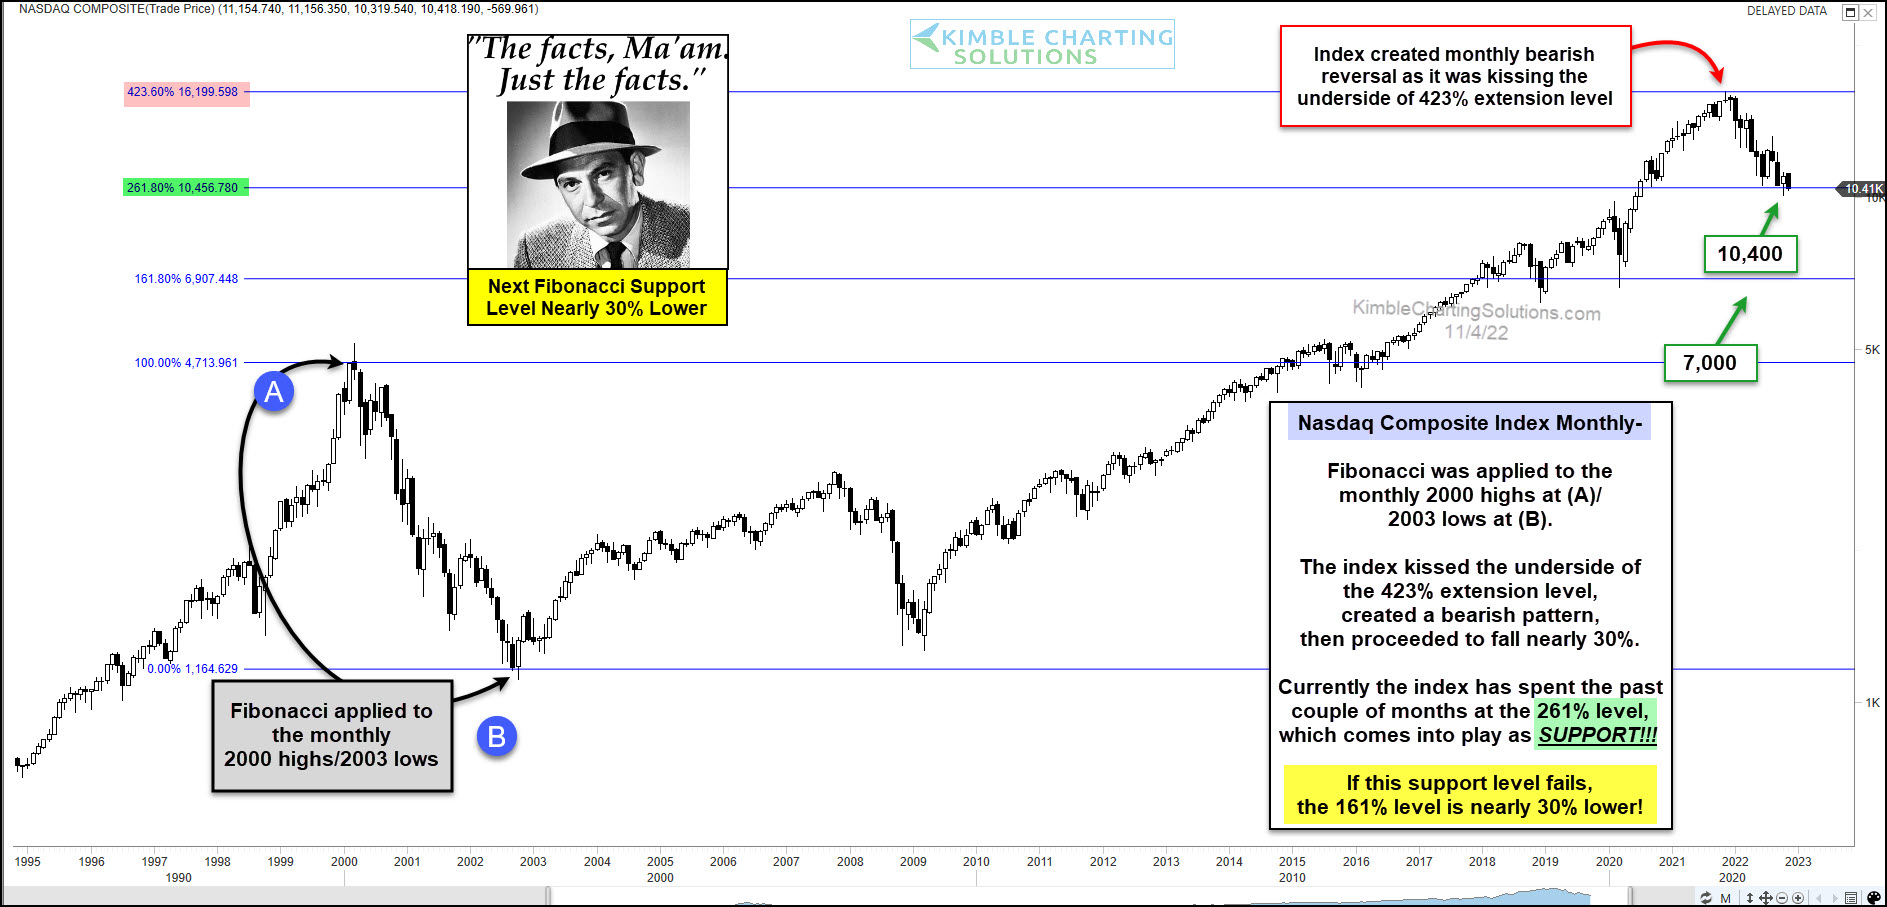
The chart below looks at the Nasdaq Composite on a long-term “monthly” timeframe with key Fibonacci levels.
As you can see, the Nasdaq rallied as high as the 423% Fibonacci extension level before reversing lower. That reversal has sent the Nasdaq sputtering down to an important/strong price support level at the 261% Fibonacci level (10,400).
Joe Friday Just The Facts Ma’am; IF this key Fibonacci support level fails to hold, prices could fall a considerable amount. The next Fibonacci support level is the 161% level near 7,000!
In my humble opinion, tech stocks are at an important crossroads. Stay tuned!!
More By This Author:
13-Year Tech Support In Play, Will Results Be Different This Time?Is A 500% Rally In Yields, In 30-Months Enough?
Will Semiconductor Stocks Send A Trick Or Treat Message To Tech Sector?
Disclosure: Sign up for Chris's Kimble Charting Solutions' email alerts--click here.


