
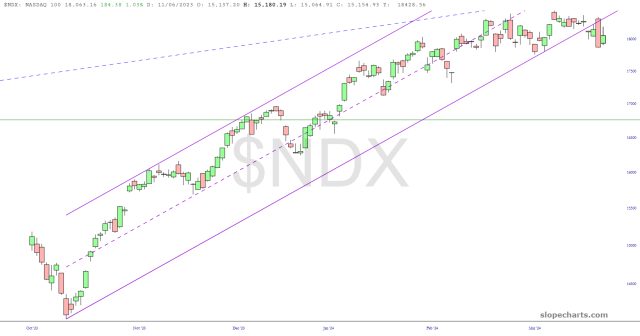
Here is the updated chart of the Nasdaq 100 cash index There are three noteworthy aspects to this: (1) over the past few weeks, the upward momentum of the chart stalled, and it wheezed its way to the supporting trendline (2) during the past week, it broken this trendline, that is to say, the lower boundary of the channel, for the first time (3) on Thursday and Friday, in spite of a lot of volatility, the price never recaptured that channel.
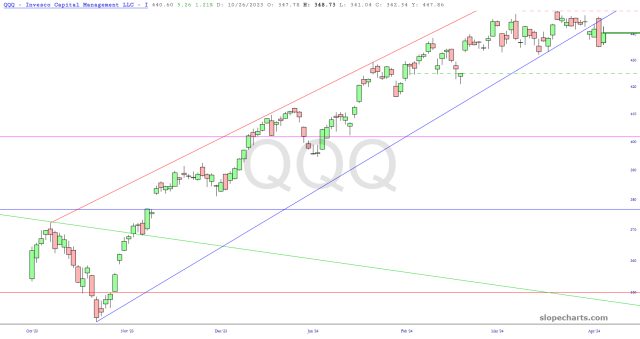
This can be seen just as plainly on the ETF equivalent, the QQQ. It is crucial at this time that the price stays below the interior of the channel. If we do start to sell off, I’d say the dashed horizontal line I’ve drawn is the most first meaningful level of support.
More By This Author:
LEVI: Resistance Turned Support, A New Long Opportunity?
GE's Bullish Inverted Head & Shoulders Pattern: A Textbook Example
Yelliquidity


Comments
Log in or sign up to join the conversation.