
U.S. stock indexes surged on Thursday after a weaker-than-expected CPI report triggered a rally in risk assets and sent US treasury yields and the USD lower. Market participants may see this as reason for theFed to slow its pace of rate hikes to avoid tipping the US economy into recession in 2023.
Major US stock indices furiously rallied and experienced their best day in years after the October CPI report surprised to the downside. Although headline and core inflation remained elevated and above the Federal Reserve’s 2% target, both figures showed tentative signs of moderation, causing U.S. Treasury yields to fall sharply.
The benchmark ten-year treasury yield plunged more than 25 bp to 3.84%, a level not seen in four weeks, but also below the psychological level of 4.0%. The two-year yield also fell to 4.3% triggering a stampede away from the USD on bets the worst of inflation is over.
In addition, several Fed speakers today added hope to a downshift in the Fed’s normalization cycle. The presidents from San Francisco, Cleveland and Philadelphia mentioned that while inflation remains elevated and more rate hikes are needed, longer-term expectations remain anchored and that at some point it would be appropriate to weigh a slowdown in the pace of rate rises to assess the effects of cumulative tightening.
According to CME, the probability of a 50-bp rate increase for the December 14 FOMC meeting now stands at 85%. Interestingly, the sentiment coincides with the tweet from the Wall Street Journal’s chief economics correspondent covering the fed who said that after today’s CPI report the stage was ready for a 50bp rate hike at the next meeting.
The positive mood continued throughout the day, despite the turmoil in the cryptocurrency space caused by FTX’s liquidity and solvency issues. At close, the Dow, the Nasdaq 100 and the S&P 500 gained 3.69%, 7.49%, and 5.53% respectively. All the sectors of the S&P advanced with technology leading the charge higher.
TECHNICAL OUTLOOK
From a technical standpoint, the S&P 500 set a monthly high today and closed above the 100-day moving average of 3909, a bullish development for price action. If buyers retain control of the market, the next resistance to consider appears around the psychological 4,000 level, an area defined by the 38.2% Fib retracement of the 2022 sell-off. On the downside, support is found at the 3850 level.
S&P 500 (ES1) Mini Futures Daily Chart
(Click on image to enlarge)
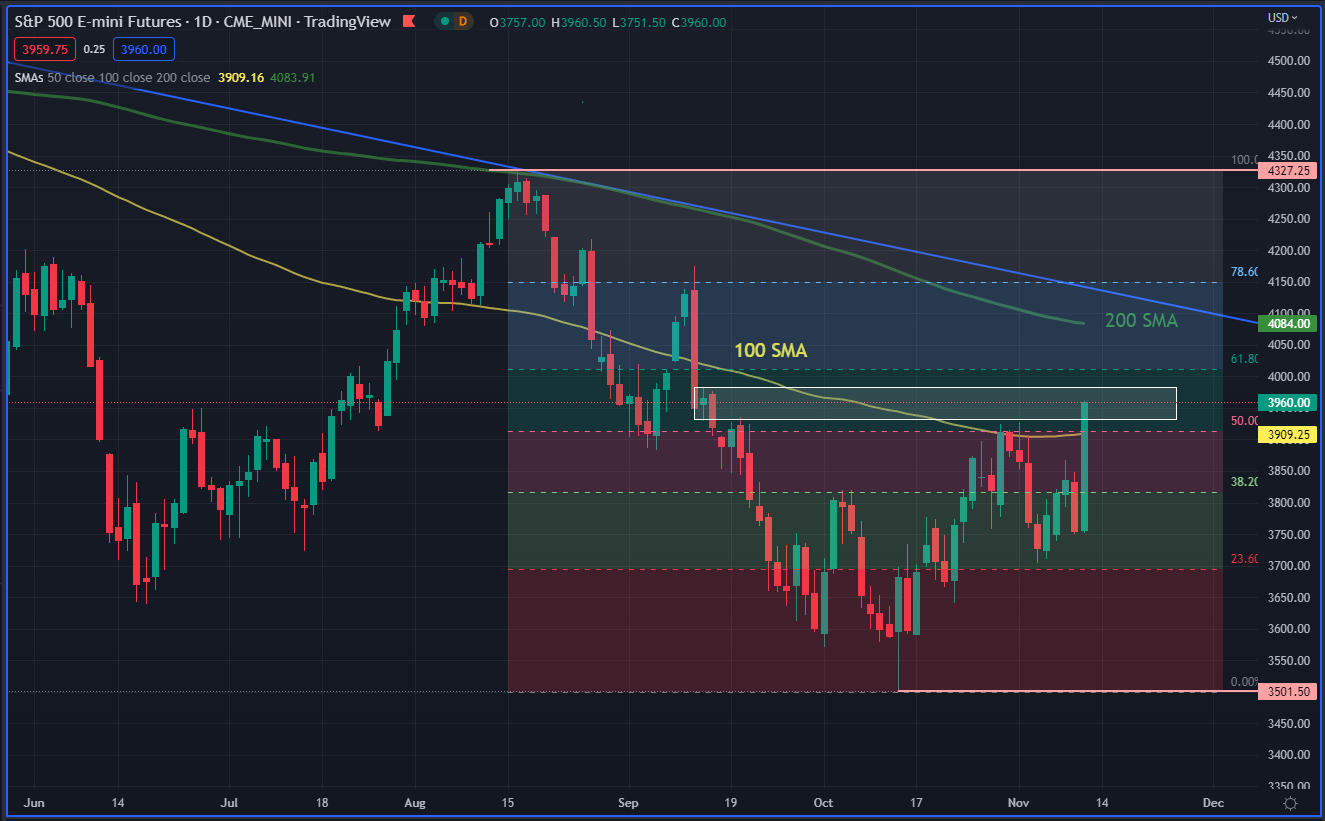
S&P 500 Mini Futures Chart. Prepared UsingTradingView
Looking ahead, all eyes are on the University of Michigan's preliminary figure on consumer sentiment, amid signs that the pace of the economy is already moderating.
More By This Author:
USD Forecast: DXY Prepares For U.S. CPI, 110 Support Handle In FocusGold Prices May Fall On October US Inflation Data, Here Are Key Levels To Watch
The Fate of the US Dollar, the Dow, and Gold After US Midterms, US Inflation Data


Comments
Log in or sign up to join the conversation.