
Gold prices were little changed on Wednesday amid a divergence between the US Dollar and Treasury yields. The anti-fiat yellow metal tends to be highly influenced by the latter two moving in the same direction. For example, consider rising US Dollar and Treasury yields (which has been the case this year). The two moving higher have had a deflationary effect on gold.
Over the past 24 hours, risk aversion struck Wall Street. The S&P 500 ended a 3-day winning streak, falling about 2.1% on Wednesday. A combination of unfolding US mid-term results and a selloff in cryptocurrencies were the likely culprits. Risk aversion boosted the demand for US Dollars, pushing the Greenback higher. Meanwhile, traders took a safety in bonds, depressing Treasury yields.
The higher US Dollar and softer government bond rates offered conflicting fundamental forces for the yellow metal. That may change over the coming 24 hours. All eyes are on October’s US inflation report, due to cross the wires at 13:30 GMT. The headline inflation rate is seen slowing to 7.9% y/y from 8.2% in September. Core prices, which exclude food and energy, are seen slowing to 6.5% y/y from 6.6% prior.
Disinflation will be most welcome for the Federal Reserve, but the gap between headline and core CPI will likely continue narrowing amid elevated housing costs. Down the road, this may be a problem for officials. The Citi Economic Surprise Index tracking the US remains in positive territory. That may open the door to a larger-than-expected outcome for CPI. That may boost the US Dollar and Treasury yields, leaving gold at risk.
Gold Technical Analysis
On the daily chart, gold has confirmed a breakout above the falling trendline from March. That is offering a bullish shift for XAU/USD. Still, Wednesday’s performance was rather lackluster in the context of the breakout. Moreover, the 100-day Simple Moving Average held. It may reinstate the downside bias. If not, further gains place the focus on the 61.8% Fibonacci retracement level at 1734. Otherwise, a turn lower has the former falling trendline in focus as potential support.
XAU/USD Daily Chart
(Click on image to enlarge)
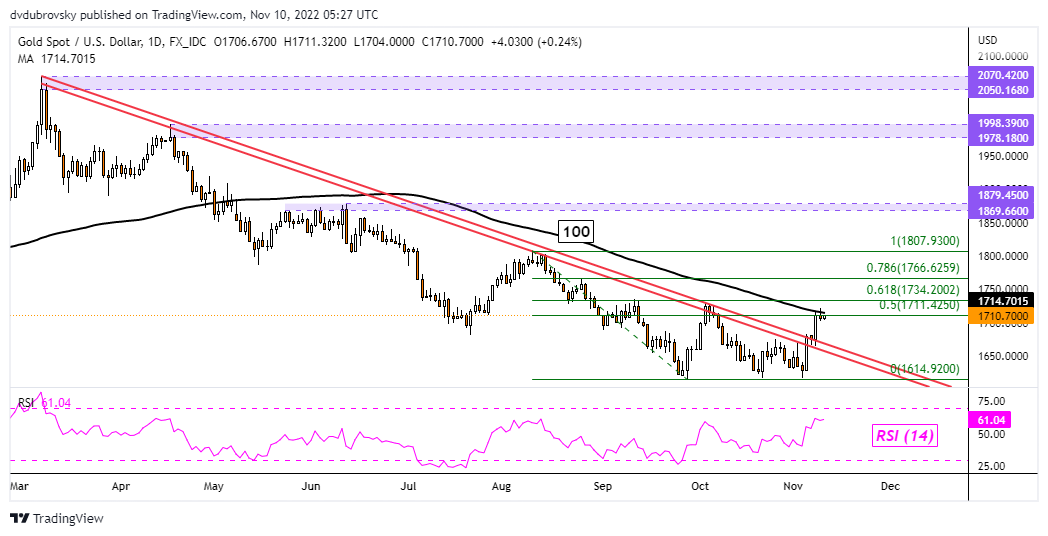
Chart Created Using TradingView
More By This Author:
The Fate of the US Dollar, the Dow, and Gold After US Midterms, US Inflation DataWTI Crude Oil Retreats As US Inventories Jump And China Covid Fears Escalate
US Dollar Under Pressure As Treasury Yields Ease Ahead Of US CPI; Where To For USD/JPY?


Comments
Log in or sign up to join the conversation.