Nasdaq 100 Nosedives As Dow Jones Holds Firm, Is The Rotation Trade Back?
The Nasdaq 100 spiraled lower Tuesday as weakness in technology stocks and discussions around potential rate hikes spurred selling activity. As a result, the tech-heavy index fell to its lowest level since early April before finding buyers around technical support at 13,400. After a day of declines, the Nasdaq 100 officially closed 1.88% lower.
NASDAQ 100 PRICE CHART: 1 – HOUR TIME FRAME (FEBRUARY 2021 – MAY 2021)
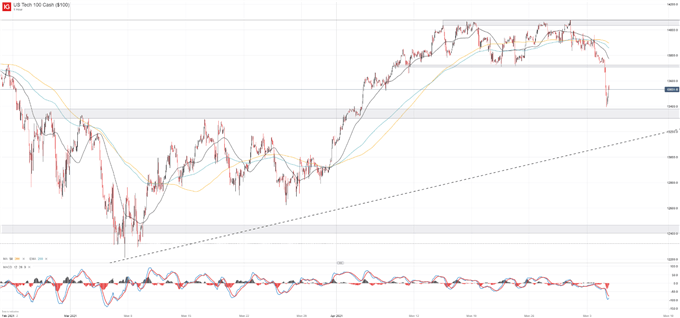
While the Nasdaq 100 and popular technology stocks were searching for buyers, the Dow Jones enjoyed a slight daily gain despite prior turbulence and considerable weakness elsewhere. The disjointed price action sparked a revival in discussion around the reflation trade theme which originally gained popularity early in the first quarter when large technology stocks first began to stumble. The reflation trade theme can be roughly measured through a ratio of the Nasdaq 100 to the Dow Jones.
NASDAQ 100 TO DOW JONES RATIO DIVES LOWER
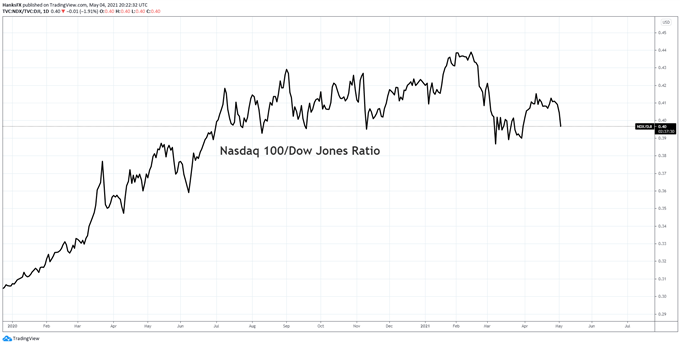
This ratio fell to its lowest level since late March on Tuesday, despite modest moves in US Treasury yields which had been the most recent catalyst behind weakness in technology stocks. The broader macro trend, while readily apparent in the performance of the indices, was also apparent in single-stock names from each sector.
TWITTER (TWTR) PRICE CHART: DAILY TIME FRAME (MARCH 2020 – MAY 2021)
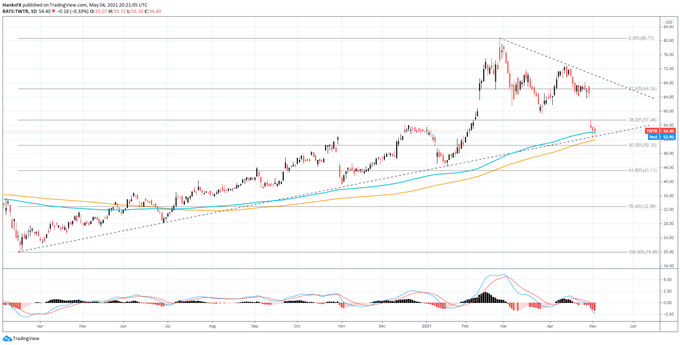
On the technology side, Twitter continued to seek longstanding support near a collection of technical levels after the stock sank more than 9% on disappointing guidance last week.
AMAZON (AMZN) PRICE CHART: DAILY TIME FRAME (JULY 2020 – MAY 2021)
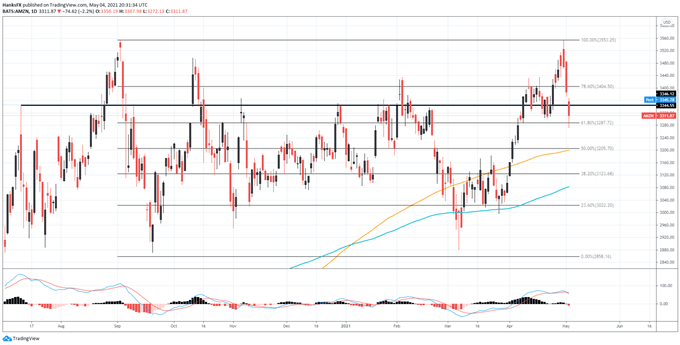
While Twitter may have to grapple with lingering effects of its earnings report, Amazon was another technology stock that sought technical assistance despite a remarkable quarterly report last week. Further still, the mega-cap technology stock has been locked within a trading range since September.
US STEEL (X) PRICE CHART: DAILY TIME FRAME (MAY 2020 – MAY 2021)
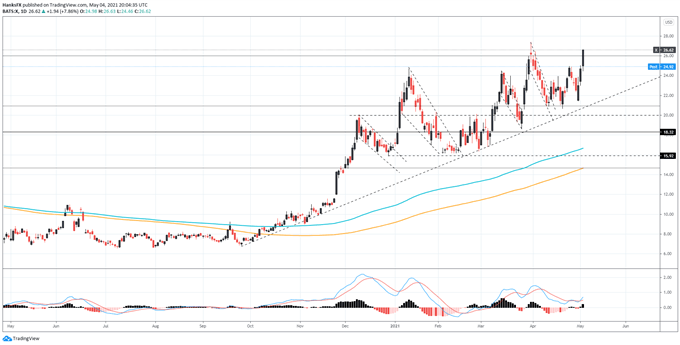
On the other hand, US Steel surged to its highest level since mid-March as the stock added to its uptrend that began in October. US Steel was not an outlier as companies like Norfolk Southern (NSC) and Exxon Mobil (XOM) notched notable gains. While the broader indices offer a bird’s eye view of emerging trends, single-stock analysis can provide deeper insight and just a few charts from the two themes suggest a continuation of Tuesday’s price action may be ahead.
To that end, expect further weakness in the Nasdaq 100 should support in some of the major technology stocks fail.


