Nasdaq 100 ETF Continues Bearish Move Lower
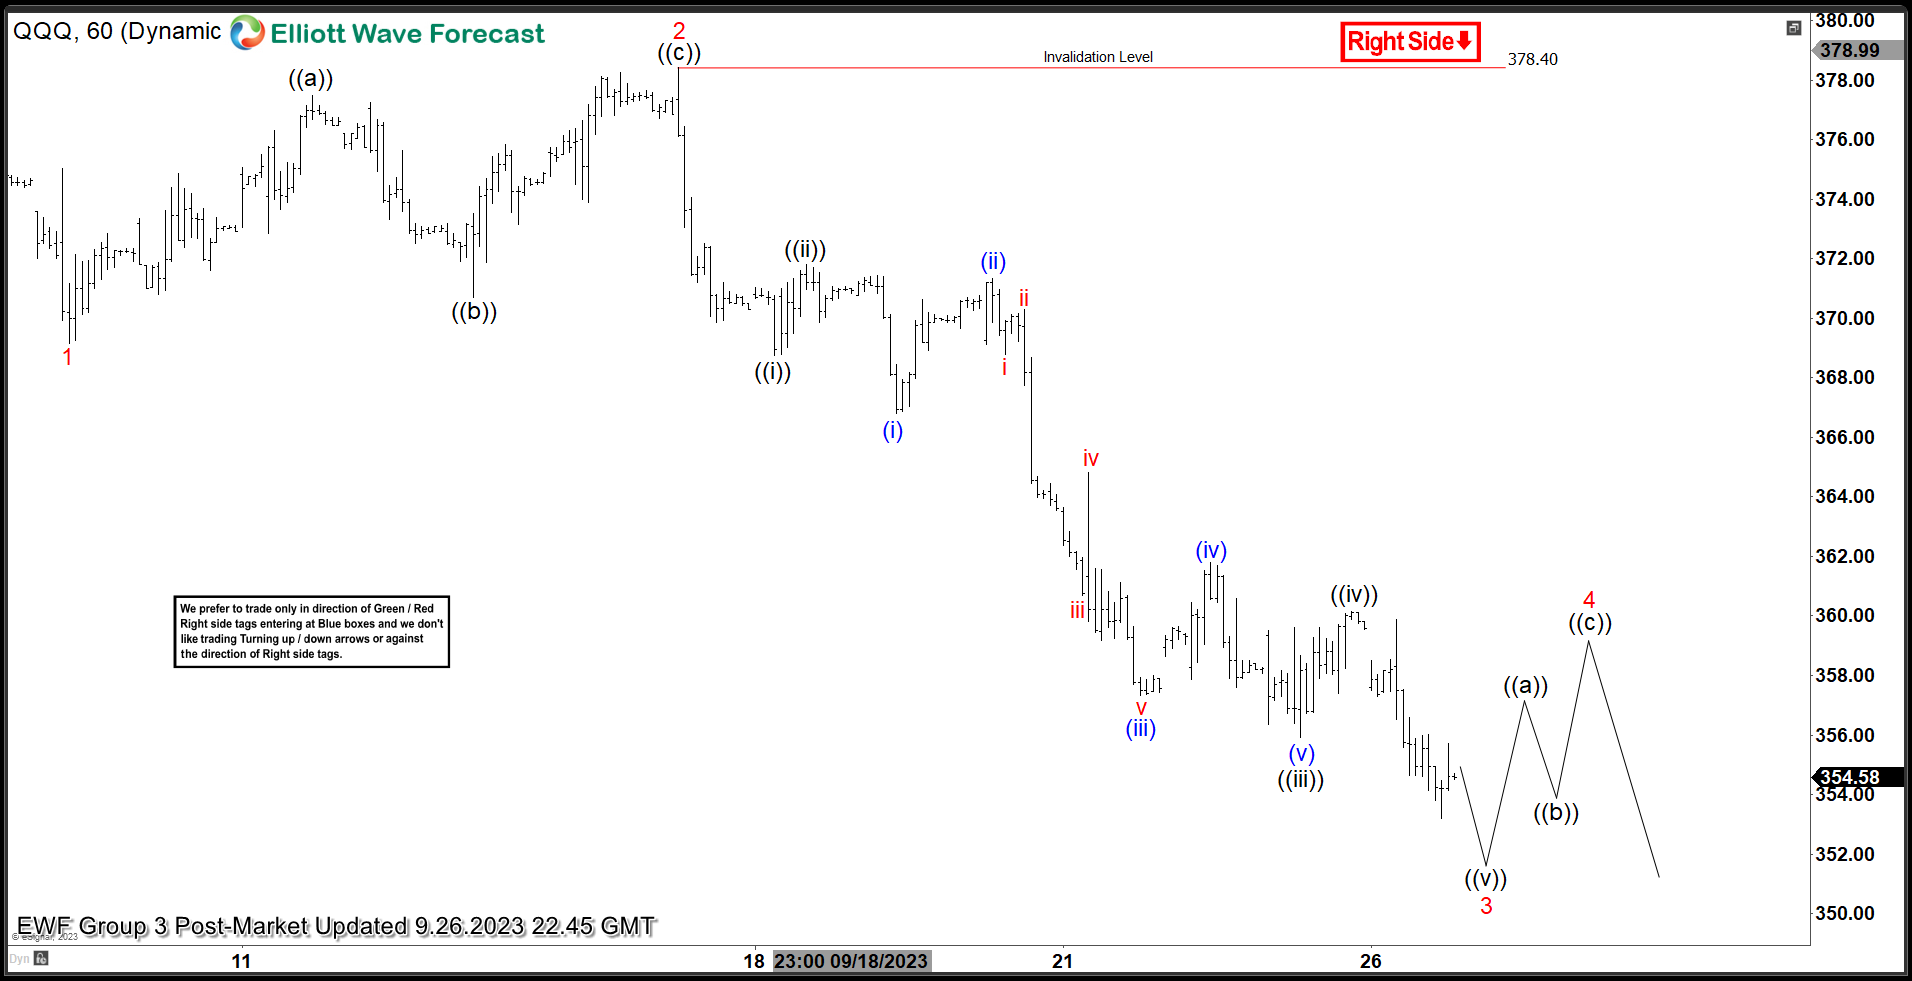
QQQ shows 3 swings lower from July 19, 2023 high favoring further downside to reach equal legs target. The drop from July 19 high is unfolding as a zig zag correction Elliott Wave structure. Down from July 19 high, wave (A) ended at 354.71 and wave (B) corrective rally ended at 381.05. Wave (C) lower is currently in progress as a 5 waves impulse structure. The ETF has broken below wave (A) August 18 low confirming the next leg lower has started.
Down from wave (B), wave 1 completed at 369.15. A zig zag wave 2 ended at 378.42. QQQ then continued lower in wave 3. Down from wave 2, wave ((i)) ended 368.74 and a small correction ended wave ((ii)) at 371.79. Market continued lower and wave ((iii)) finished at 355.93 and wave ((iv)) correction at 360.14. Currently, the market is developing wave ((v)) of 3 lower. Once wave 3 is completed, we expect 3, 7 or 11 swings higher in wave 4 before it resumes to the downside in wave 5 of (C). As far as pivot at 378.4 high stays intact, expect rally to fail for further downside. Potential target lower comes at 347.67 – 327.00 area (100% – 161.8% Fibonacci extension from wave (A).
QQQ 60 Minutes Elliott Wave Chart
More By This Author:
Walt Disney: The Stock Is Trading Within Buying AreaGold Miners Junior Looking To End Flat Correction
Russell 2000 Bearish Sequence Favors Downside
Disclaimer: Futures, options, and over the counter foreign exchange products may involve substantial risk and may not be suitable for all investors. Leverage can work against you as well as for ...
more


