

Image Source: Pixabay
Today ends a phenomenal second quarter featuring a gut-wrenching drop and a euphoric rebound. I was tempted to call it a “roller-coaster ride”, but roller coasters usually start with a slow grind to the peak, then a gut-wrenching drop before a volatile ride for the rest of the adventure.This quarter did the opposite.We started with a big drop – one that began in the weeks prior – then a volatile ride before the steady climb that continues today.
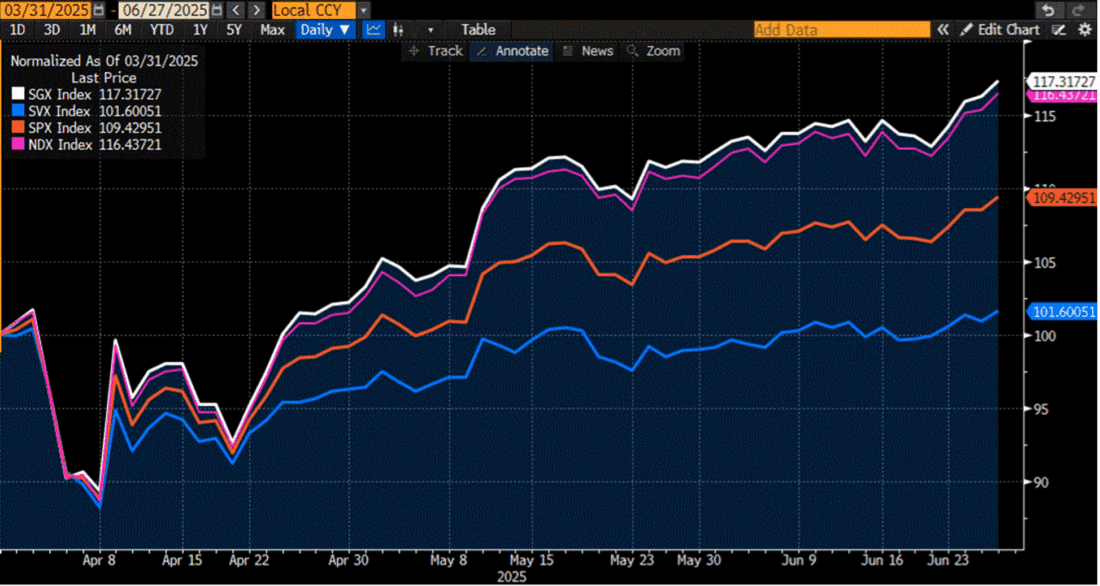
Although the most widely reported benchmarks for US stocks all did well this quarter, there are some major divergences lurking under the surface.Put simply: large cap tech and anything remotely related to artificial intelligence did quite well, while other measures lagged considerably. Looking at various indices’ results on a normalized basis is the clearest way to show how reliant we are upon growth stocks – specifically tech stocks – right now.Through Friday, the S&P 500 (SPX) had an excellent quarter by any measure, rising about +9.5% in that timeframe. But when we view the relative performance of the SPX Growth Index (SGX) versus both its Value counterpart (SVX) and the main index itself, we see a wide dispersion of performance.There is roughly an 8-percentage point spread between SGX and SPX, and again between SPX and SVX.It’s all about growth.And since the top stocks in SGX are essentially the same as those in the Nasdaq 100 (NDX), we see SGX and NDX moving in general lockstep:
Quarter-to-Date Normalized Results, SPX (orange), SGX (white), SVX (blue), NDX (magenta)
(Click on image to enlarge)
Source: Bloomberg
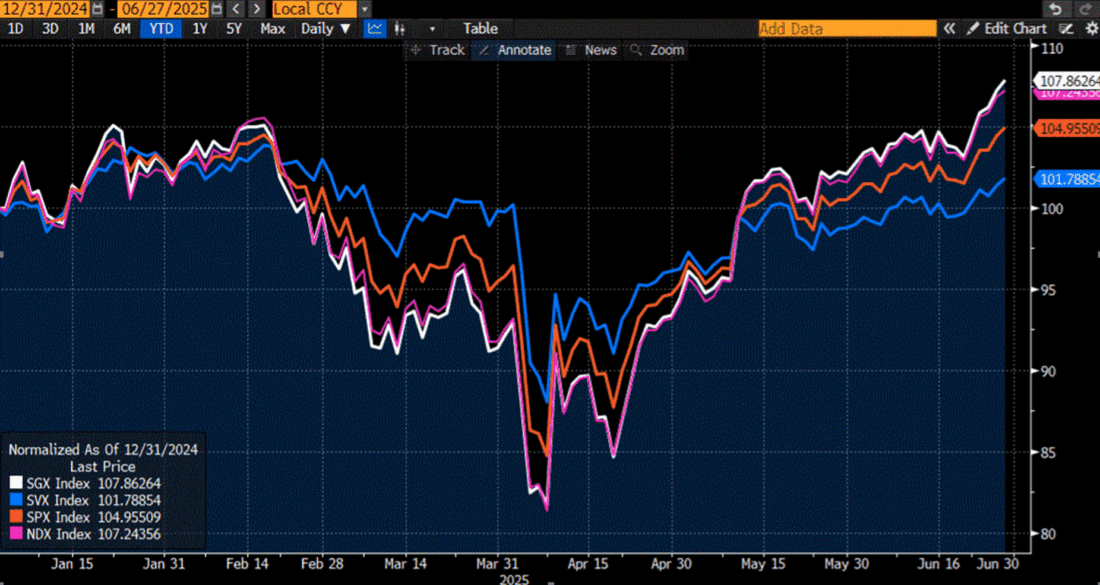
On a year-to-date basis, we see something quite similar, though the numbers are a bit different.Indeed SGX/NDX are driving the bus, +7-8% year-to-date versus 4.95% for SPX and 1.8% for SVX. But notice how SGX/NDX bore the brunt of the declines.Even though momentum is incredibly positive right now, this is a reminder that it can lead in both directions.
Year-to-Date Normalized Results, SPX (orange), SGX (white), SVX (blue), NDX (magenta)
(Click on image to enlarge)
Source: Bloomberg
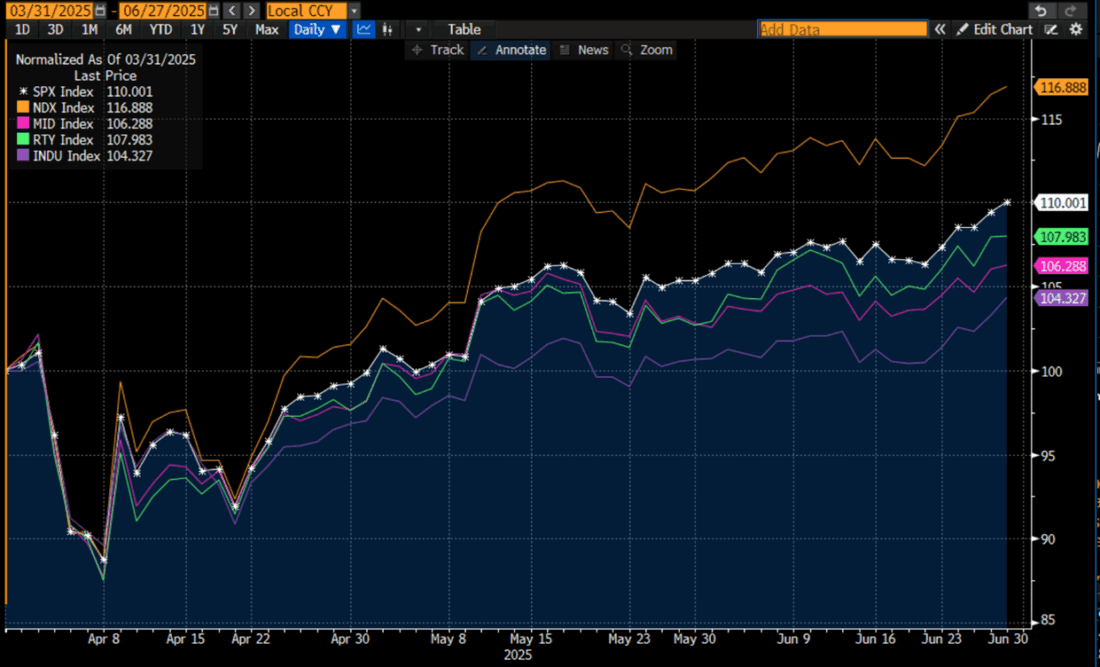
Another way to show the dominance of large-cap tech is to compare NDX and SPX with the S&P 400 Midcap (MID) and Russell 2000 (RTY) indices.We see that SPX outpaces both RTY and MID, though by a relatively narrow margin.That of course implies that each of those indices outperformed value stocks too, which is hinted at by the Dow Jones (INDU) underperforming all of them.
Quarter-to-Date Normalized Results, SPX (white), NDX (orange), MID (magenta), RTY (green), INDU (purple)
(Click on image to enlarge)
Source: Bloomberg
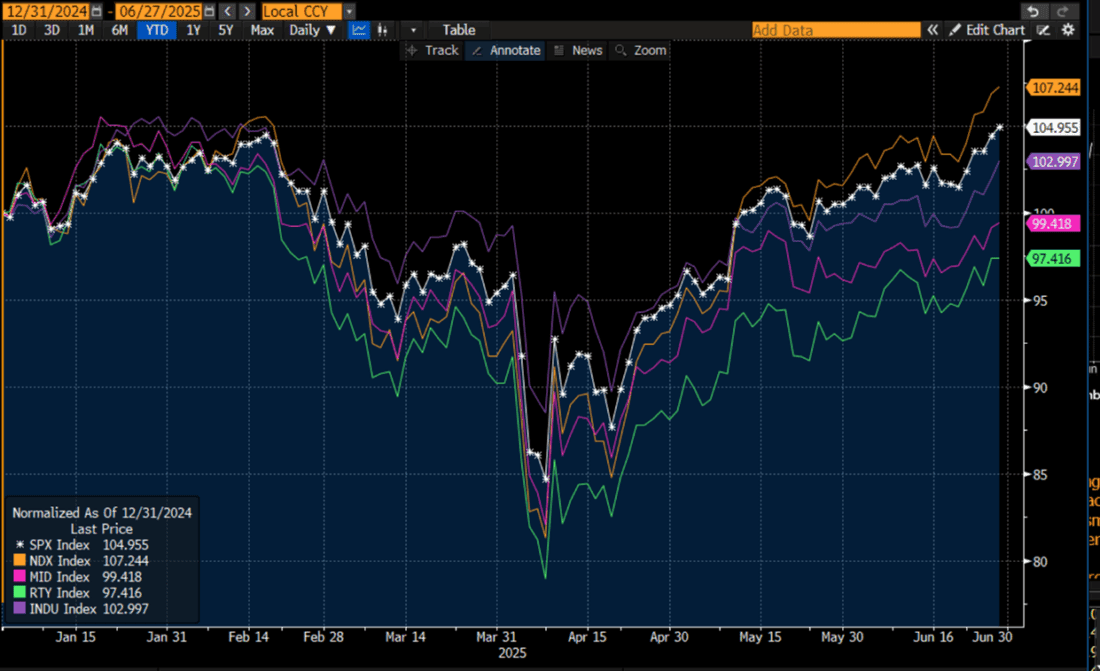
When we look at a year-to-date basis, we see, however, that the smaller-cap indices are playing catch up this quarter.Both MID and RTY were down on the year through Friday.
Year-to-Date Normalized Results, SPX (white), NDX (orange), MID (magenta), RTY (green), INDU (purple)
(Click on image to enlarge)
Source: Bloomberg
International markets have generally done well this quarter and year.Notably, this has been occurring as the US dollar sank to multi-year lows against a basket of major currencies.The falling dollar has been a boon to US multinationals whose copious international revenues benefit from a favorable currency translation, but the combination of weaker dollar and rising stocks likely indicates a steady migration of money out of various US assets into foreign markets.
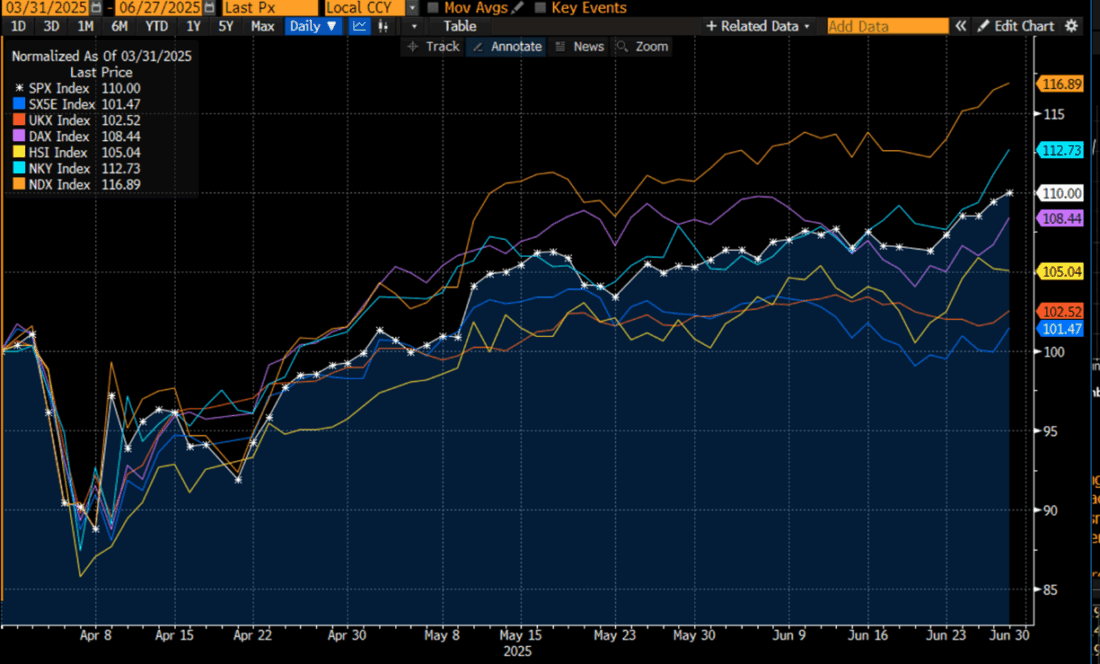
On a quarter-to-date basis, NDX remains the leader, but the Nikkei 225 (NKY) posted its own double-digit rise – outperforming SPX and a group of selected other key markets — EuroStoxx 50 (SX5E), FTSE 100 (UKX), DAX, and Hang Seng (HSI).
Quarter-to-Date Normalized Results, SPX (white), NDX (orange), SX5E (dark blue), UKX (red), DAX (purple), HSI (yellow), NKY (light blue)
(Click on image to enlarge)
Source: Bloomberg
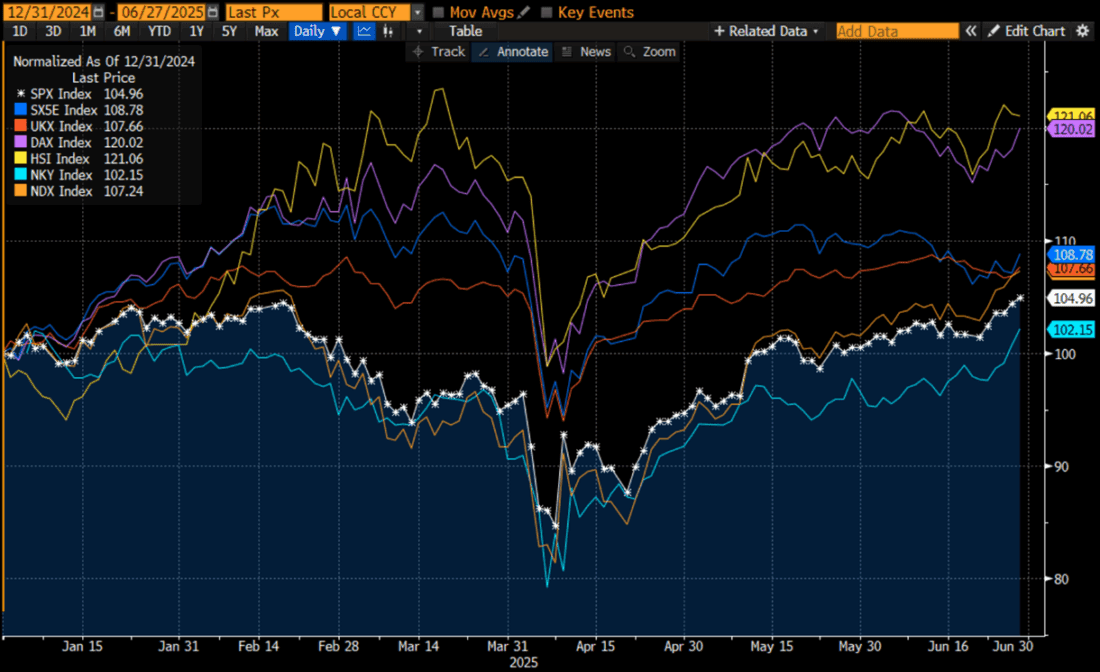
On a year-to-date basis, the clear winners have been the Hang Seng and DAX. Their 20% gains far outpace even NDX’s +7% jump, while the Euro Stoxx 50 kept pace with NDX. We see that the Nikkei is the laggard on this basis, making that index’ catch-up this quarter even more significant.
Year-to-Date Normalized Results, SPX (white), NDX (orange), SX5E (dark blue), UKX (red), DAX (purple), HSI (yellow), NKY (light blue)
(Click on image to enlarge)
Source: Bloomberg
So, what might we expect going forward?“MOMO and FOMO” are likely to dominate until proven otherwise.Newton’s First Law applies: A body (market) that is in motion will stay in motion until acted upon by an external source.There are plenty of potential risks, and thus a solid wall of worries, lurking on the horizon, but implied volatilities are relatively low because the market has increasingly decided to look past them.These include the looming tariff moratoria, the budget bill potentially causing increasing deficits, the weak dollar, and the upcoming earnings season.Except for a few brief painful weeks, none have proven powerful enough to disrupt the momentum.Whatever hasn’t killed this market made it stronger.But just because none of them have so far, doesn’t mean they won’t.Watch bonds – a much steeper yield curve would signal deficit fears – and earnings.Either could prove to be that “external force”, even if they are not a cause for concern now.
More By This Author:
Was There Really Any Doubt?“Spiderman Market” Climbs Wall Of Worry
Powell Says Nothing To Hurt Market Confidence


Comments
Log in or sign up to join the conversation.