

Image Source: Unsplash
Moderna, Inc. (MRNA) is an American pharmaceutical and biotechnology company. Founded in 2010 and headquartered in Cambridge, Massachusetts, USA, it is a part of NASDAQ100 and S&P500 indices. Investors can trade it under the ticker MRNA at NASDAQ. The company’s only commercial product is the COVID-19 vaccine. Moreover, it has a portfolio of vaccine candidates for such disease areas as influenza, cancer, HIV, Epstein-Barr virus, Nipah virus, chikungunya, respiratory syncytial virus and others. Will this broad engagement promote the stock price into a new rally? In our initial article from April 2020, we called for more upside in Moderna. We were right. Then, in February 2022, we saw pullback taking place, which provided the next buying opportunity. Now, Moderna stock has reached the weekly bluebox area. In the current blog, we discuss the wave structure, buying area and targets.
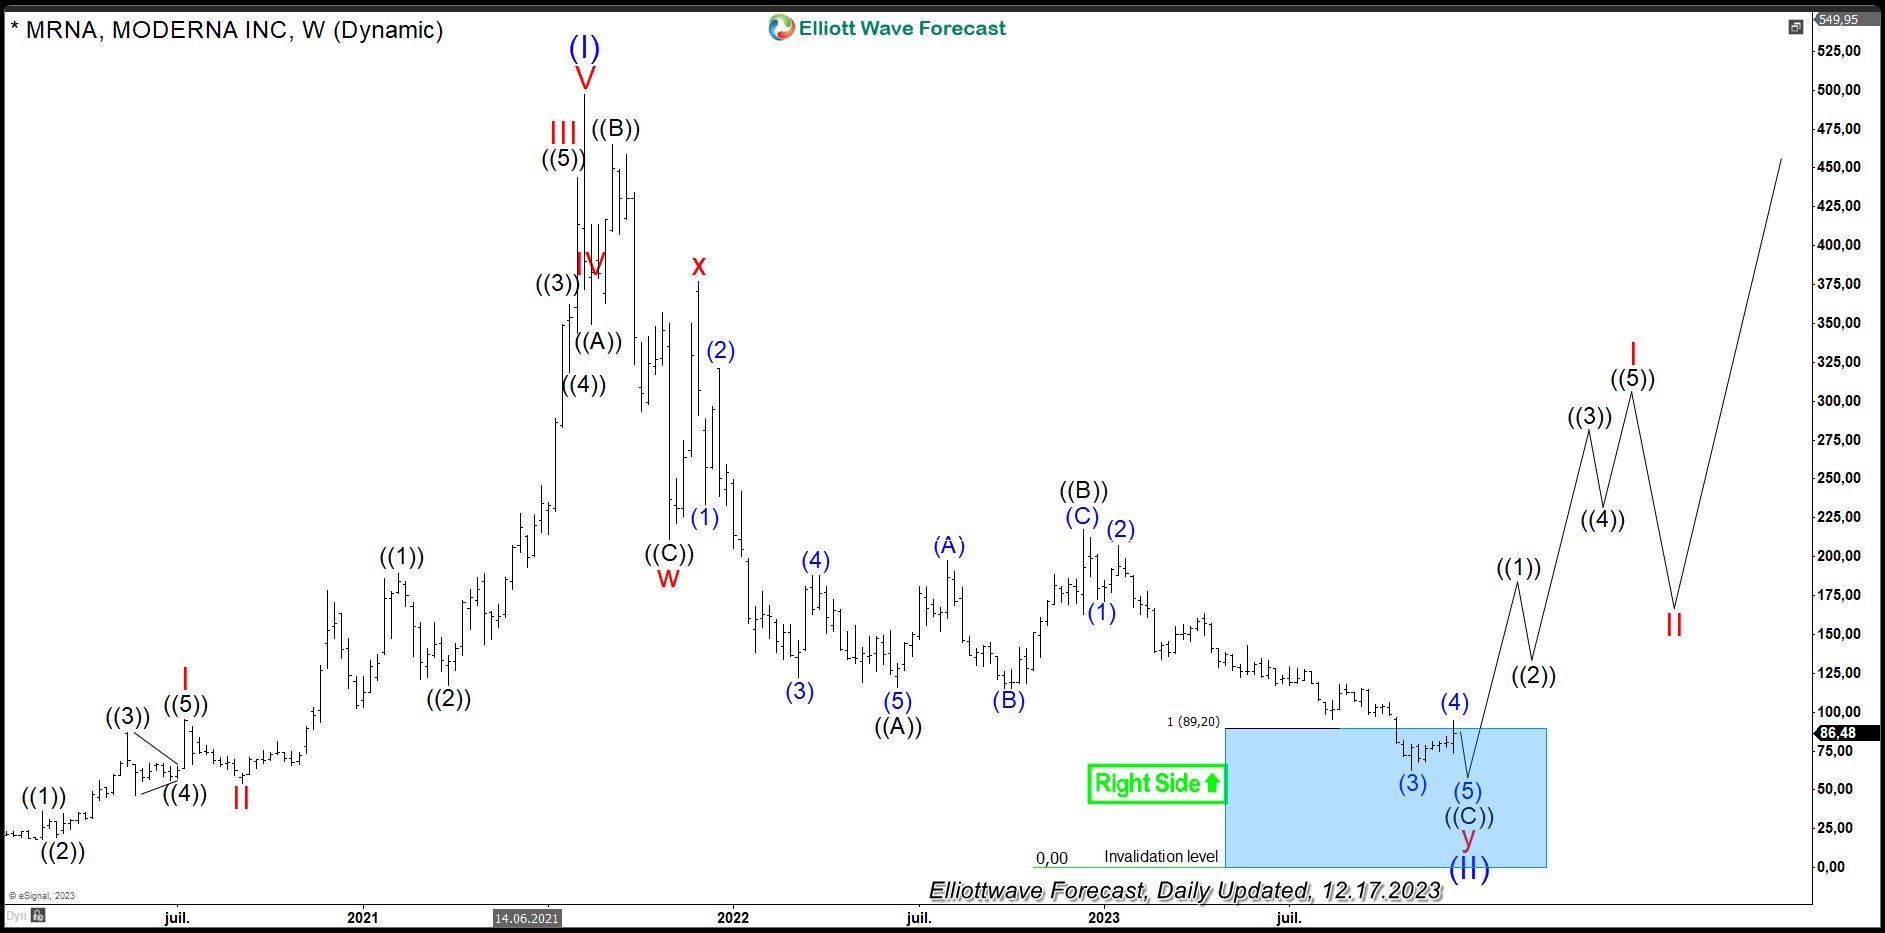
Moderna Weekly Elliott Wave Analysis 12.17.2023
The weekly chart below shows the Moderna stock MRNA traded at Nasdaq. From the all-time lows, the stock price is showing Elliott wave motive wave pattern. The main cycle up in blue wave (I) of super cycle degree has ended by printing the all-time high in August 2021 at 497.49. Clearly, one can see an impulse with an extended wave III. After 5 waves higher in wave (I), the correction lower in 7 swings of wave (II) lower is still in progress.
Firstly, 3 swings of red wave w have printed a low in November 2021 at 210.96. Secondly, bounce in red wave x has set a connector in the end of same month at 376.65 highs. Thirdly, price has broken 210.96 lows opening up a bearish sequence. Now, 3 swings of red wave y are entering 89.20-0.00 support area. There, wave (II) should end and next bull run in blue wave (III) should take place.
Investors and traders can be looking to buy wave (II) from 89.20-0.00 area. The target for wave (III) will be $497.49 and even higher.
(Click on image to enlarge)
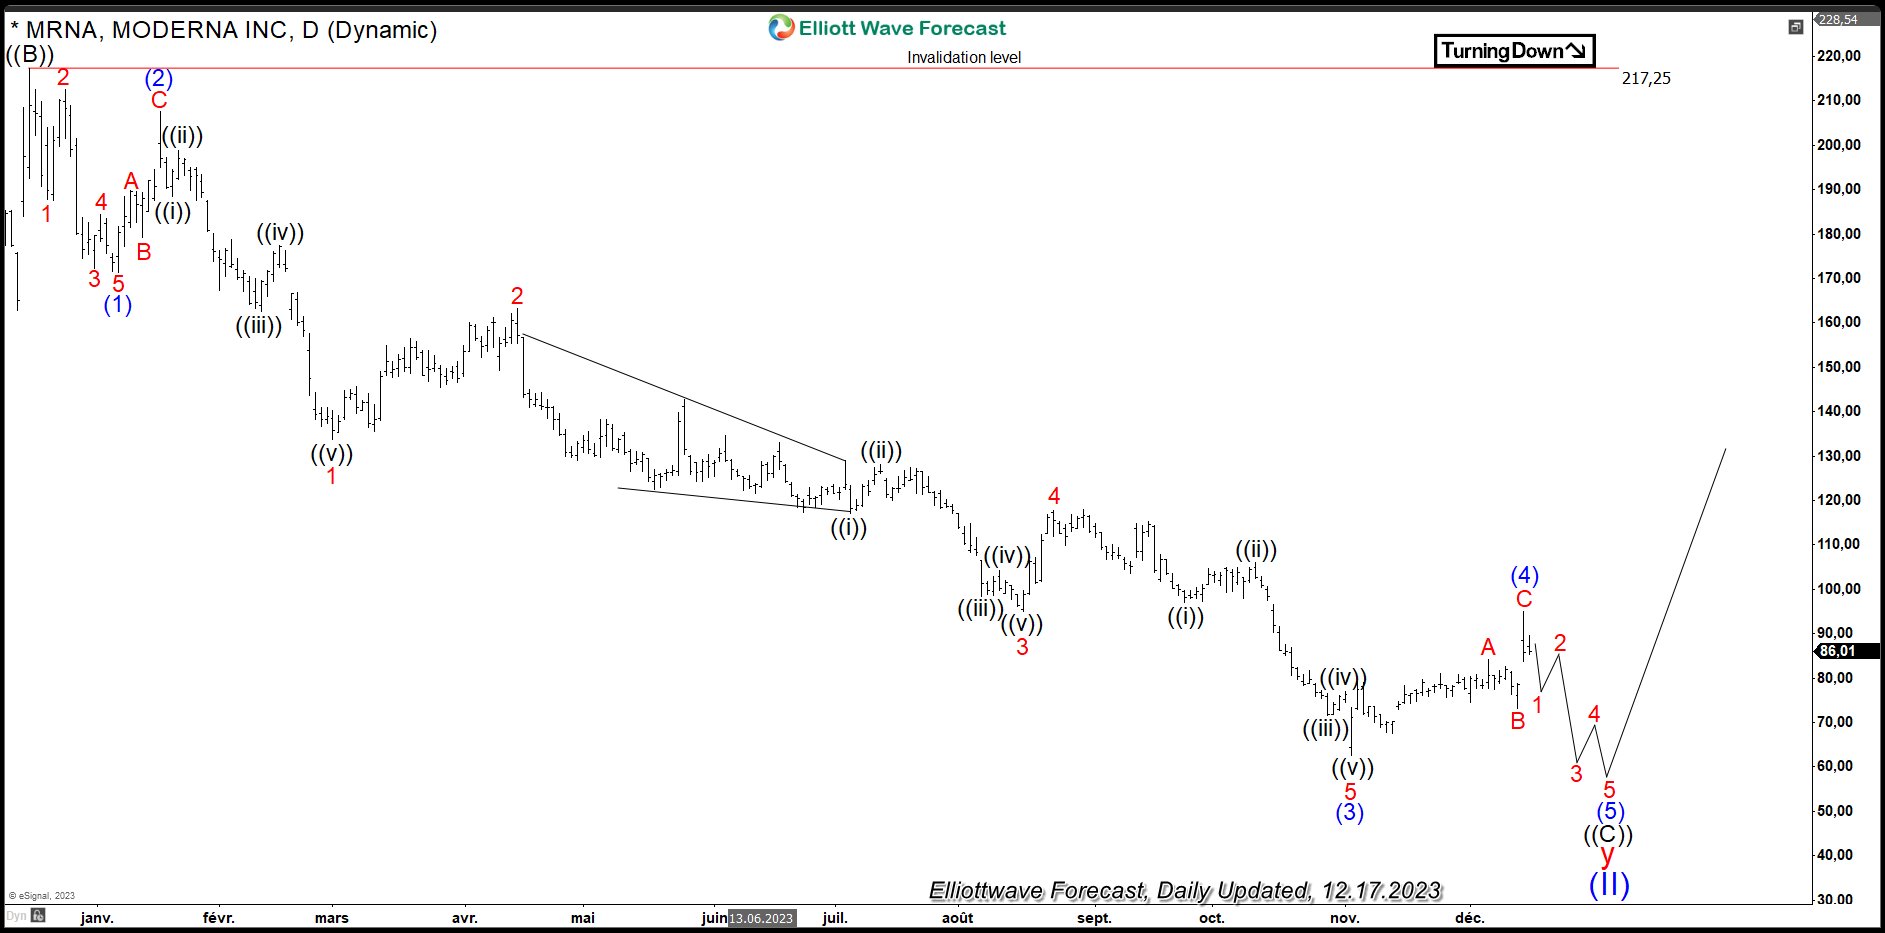
Moderna Daily Elliott Wave Analysis 12.17.2023
The daily chart below shows in more detail the 7th swing of the double three correction in blue wave (II). From December 2022 highs at 217.25, the final swing lower is unfolding as an impulse in black wave ((C)) being 5-3-5-3-5 structure. Within it, blue wave (3) is showing an extension beyond 2.618x of the wave (1). From November 2023 lows, bounce in wave (4) might have ended in December 2023. While below $94.93, blue wave (5) can still extend lower to complete the structure in wave ((C)). Once finished, expect next bullish cycle in black wave ((1)) of red wave I of blue wave ((III)) to start.
(Click on image to enlarge)
More By This Author:
Nikkei Strong Reaction Higher From The Equal Legs Area
General Electric Co. Blue Box Area Wins Again. What’s Next?
QQQ Should See Further Upside In Impulsive Rally


Comments
Log in or sign up to join the conversation.