Microsoft Should Remain Supported

Image Source: Unsplash
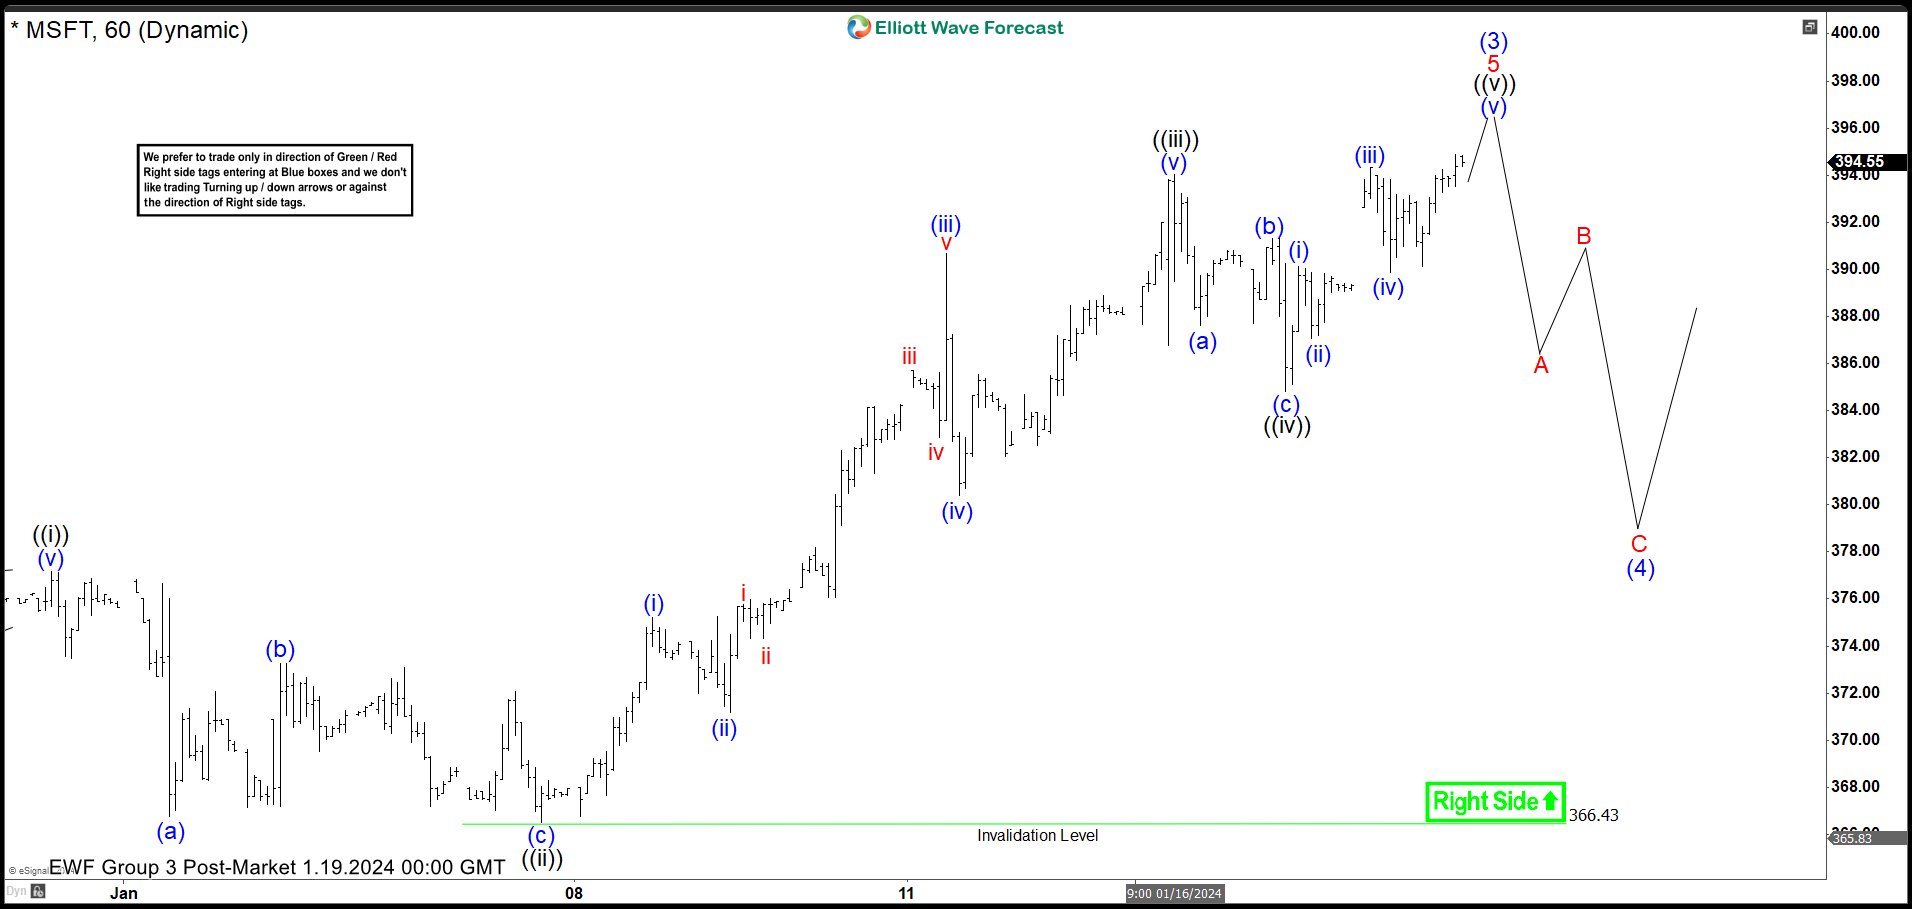
Short-term Elliott Wave View in Microsoft (MSFT) suggests rally from the 12.15.2023 low is unfolding as a 5 waves impulse. Up from the 12.15.2023 low, wave ((i)) ended at 376.94, and dips in wave ((ii)) ended at 366.50 as the 1-hour chart below shows. Internal subdivision of wave ((ii)) unfolded as a zigzag structure. Down from wave ((i)), wave (a) ended at 366.77, and rally in wave (b) ended at 373.26. Wave (c) lower ended at 366.43 which completed wave ((ii)).
The stock resumed higher in wave ((iii)). Up from wave ((ii)), wave (i) ended at 375.20, and dips in wave (ii) ended at 371.19. Wave (iii) higher ended at 390.68 and a pullback in wave (iv) ended at 380.38. Final leg wave (v) higher ended at 394.03 which completed wave ((iii)). The stock then pulls back in wave ((iv)) as a zigzag structure. Down from wave ((iii)), wave (a) ended at 387.62, and wave (b) ended at 391.30.
Wave (c) lower ended at 384.81 which completed wave ((iv)). The stock resumes higher in wave ((v)) with internal subdivision as 5 waves. Up from wave ((iv)), wave (i) ended at 390.11, and wave (ii) ended at 387.05. Wave (iii) higher ended at 394.32 and the pullback in wave (iv) ended at 389.85. Expect the stock to complete wave (v) soon which should complete wave ((v)) of 5 of (3) in a higher degree. Afterward, it should do a larger pullback in wave (4) in 3, 7, or 11 swings before it resumes higher.
Microsoft (MSFT) 60 Minutes Elliott Wave Chart
MSFT Elliott Wave Video
Video Length: 00:04:23
More By This Author:
Russell 2000 Rally Should Fail For More DownsideNatural Gas Perfect Reaction Higher From Extreme Area
EURUSD Short Term Looking For Further Downside
Disclaimer: Futures, options, and over the counter foreign exchange products may involve substantial risk and may not be suitable for all investors. Leverage can work against you as well as for ...
more


